Introduction
This documentation explains how to install and operate Latence Technologies' real-time cloud analytics solution for cellular networks with a special focus on ultra-low latency connectivity.
Every millisecond counts!
Assumed hosting architecture
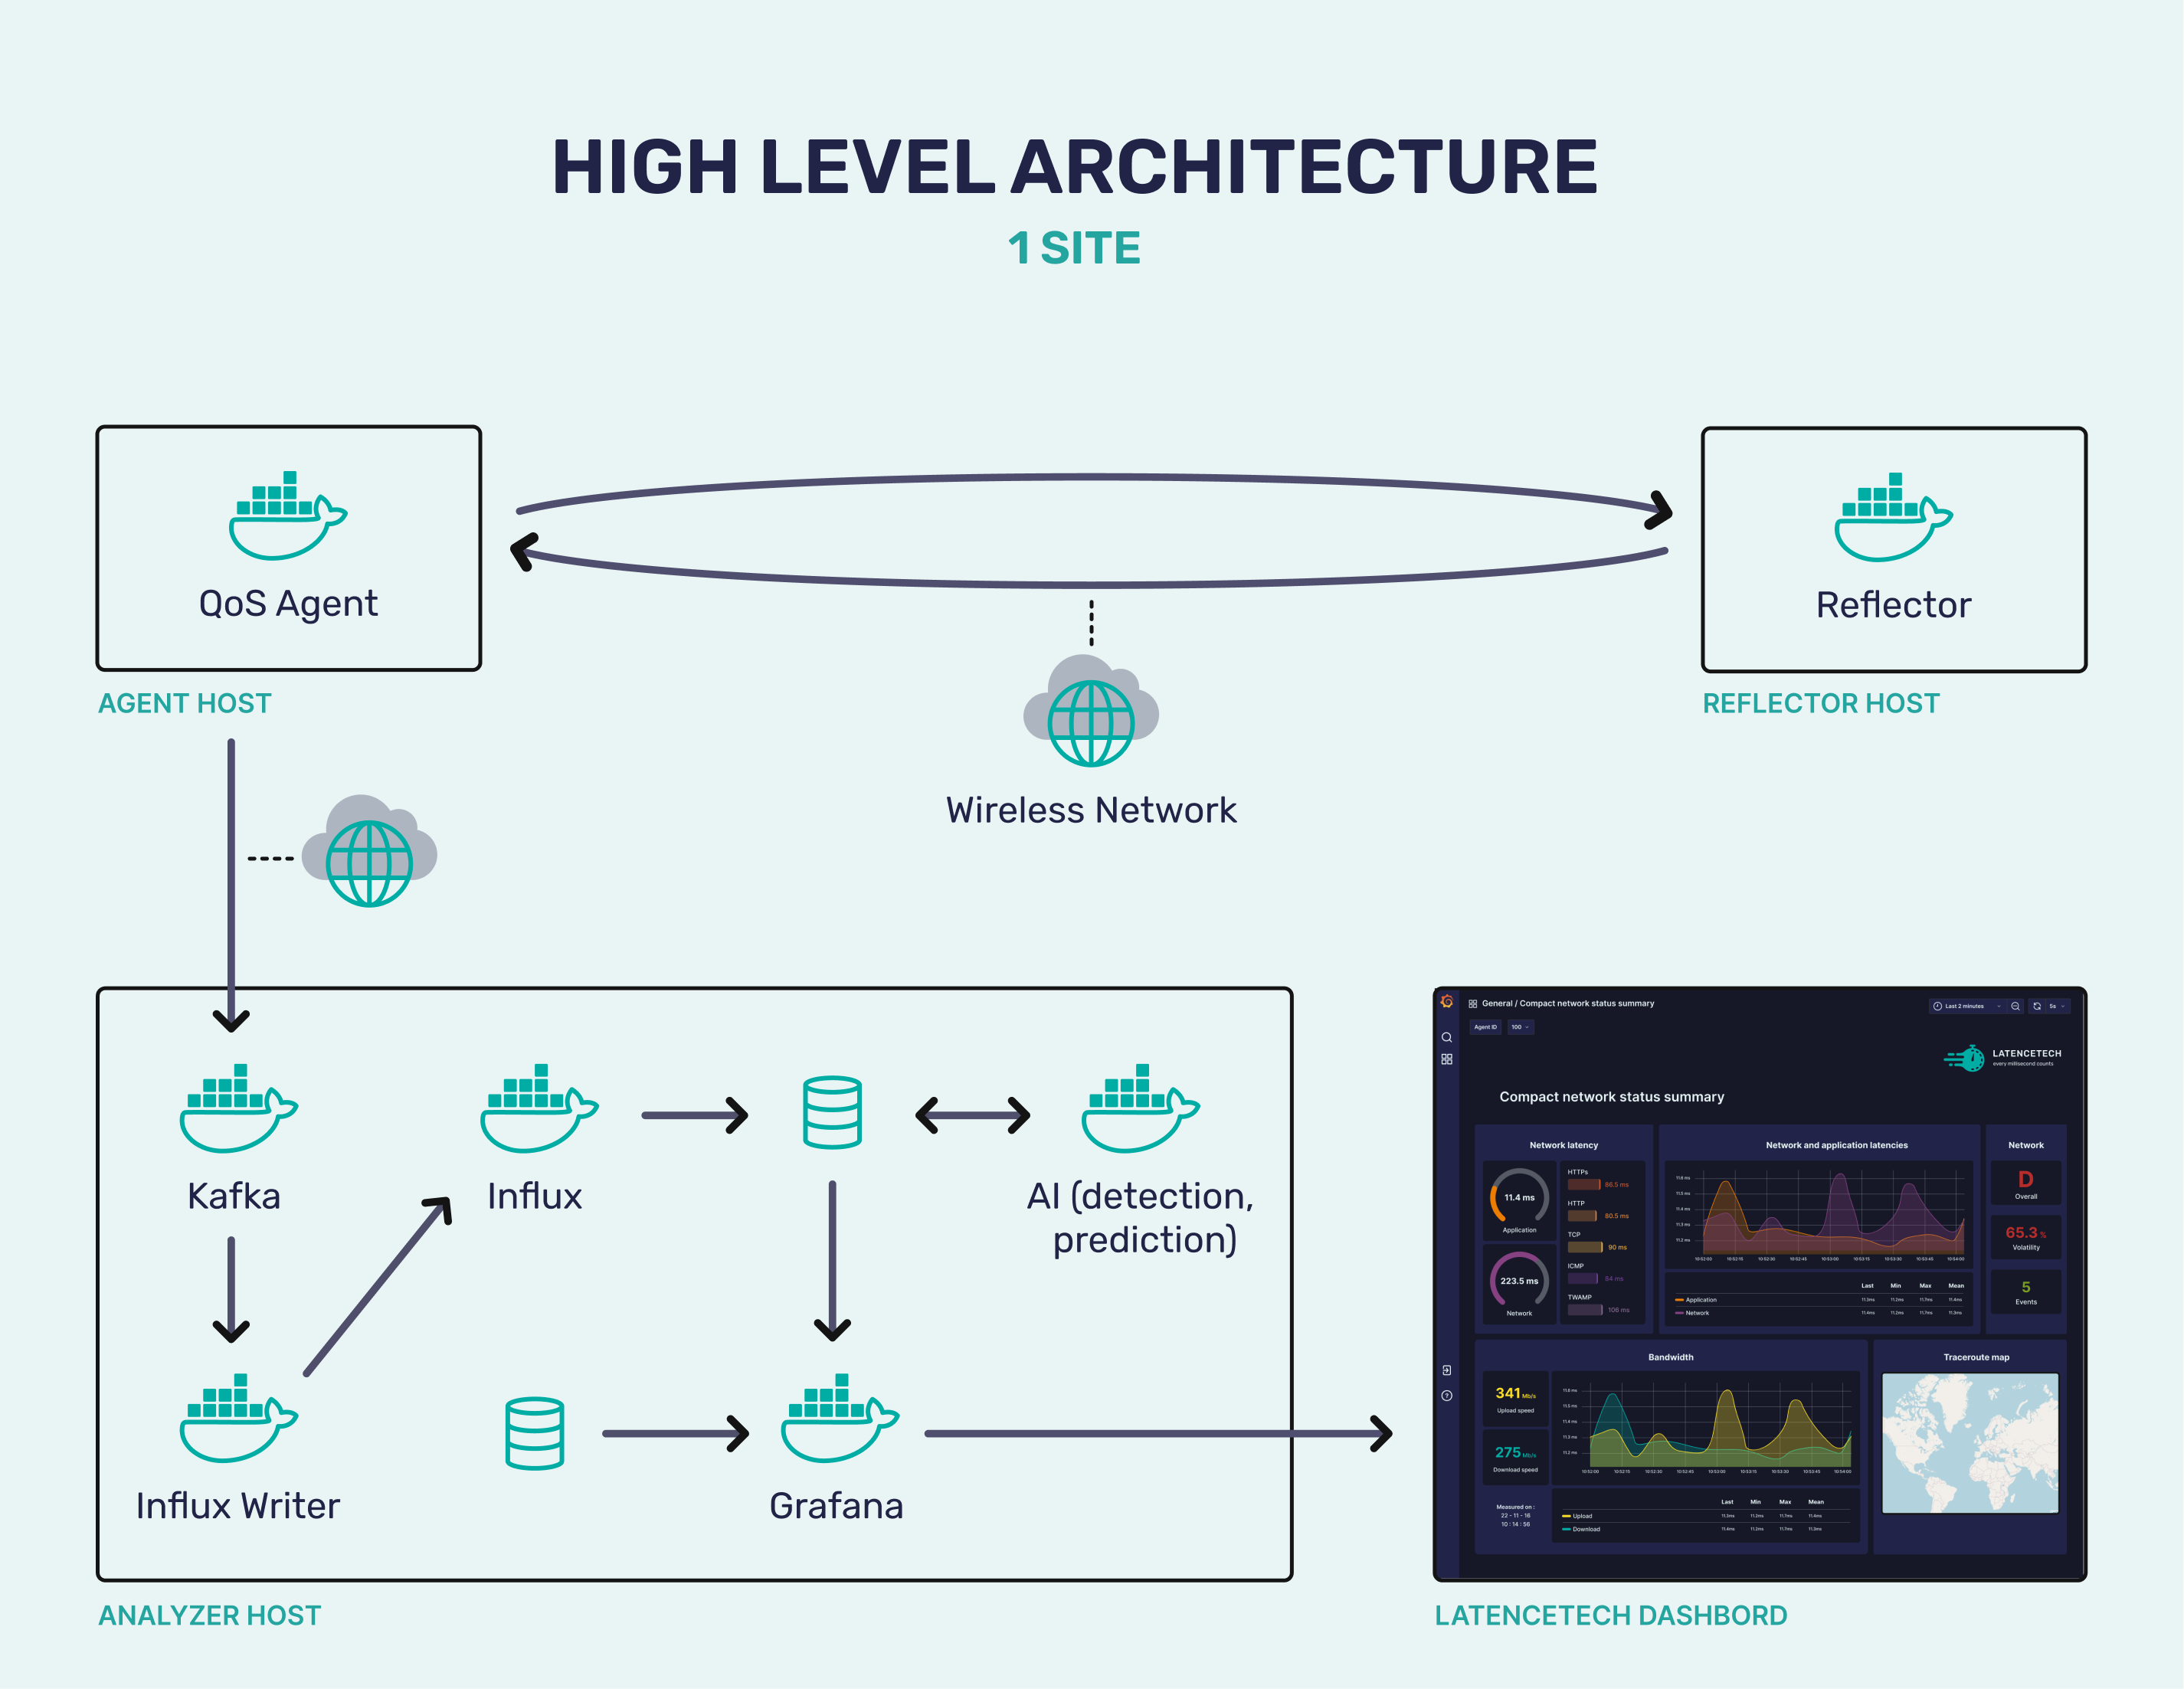
The picture below illustrates the assumed hosting architecture where 3 virtual machines are deployed:
- The top-left hosts a QoS-agent docker
- The top-right hosts a Reflector docker
- The bottom-left hosts the dockers composing the analyzer system
Finally, the image at the bottom right shows an example of dashboard produced by grafana.
Note: A reflector can respond to multiple agents and an analyzer can receive data from multiple agents. It is important to make sure that each agent has its own agent ID (LTI_agent_id), so that the data are differenciated in the analyzer. It will be possible to display the data of every site by selecting the agent ID in grafana.
Main open-source components
Here is a table of the 4 main open source components that we are using.
| Component | Version | Link |
|---|---|---|
| Grafana | 12.0.0 | https://grafana.com/ |
| InfluxDB | 2.7.11 | https://www.influxdata.com/ |
| Kafka | 4.0.0 | https://kafka.apache.org/ |
| Telegraf | 1.34 | https://github.com/influxdata/telegraf |