Further considerations
This section summarizes information about the latency measurement, sampling, volumetry, and data.
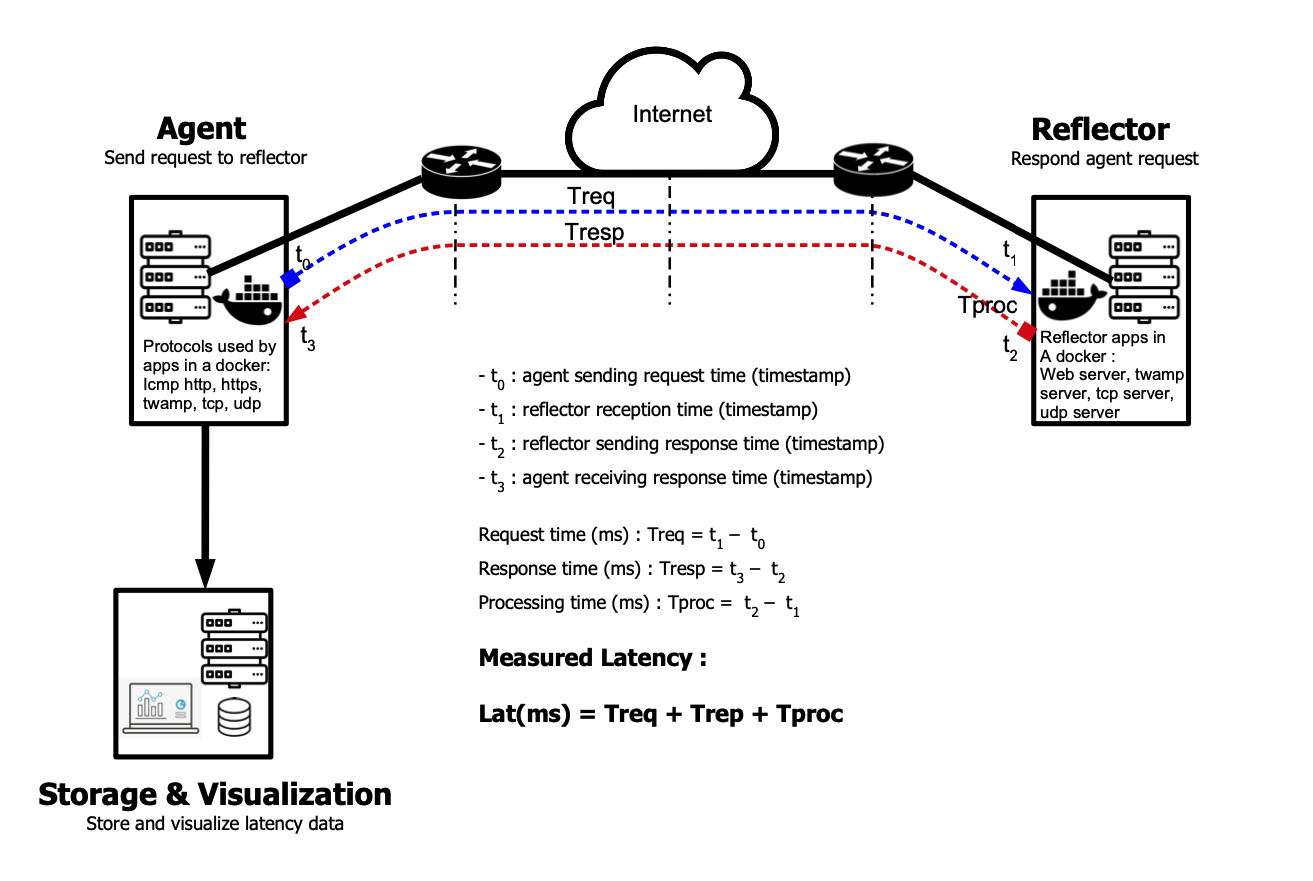
Latency measurement method
This diagram illustrate how do we calculate latency from the QoS-Agent.
Default sampling rates
Below are the default sampling rates. Refer to the Custom configurations section to learn how to modify them.
Note: Any modification to the configuration file of a running docker needs to be followed by a restart (stop, start) of the docker.
| Protocol | Sampling rate |
|---|---|
| TWAMP | every 2 seconds |
| ICMP | every 2 seconds |
| HTTP | every 2 seconds |
| HTTPs | every 2 seconds |
| TCP | every 2 seconds |
| UDP | every 2 seconds |
| TraceRoute | every 15 minutes |
| PacketLoss | every 5 seconds |
| Iperf3 | every 2 hours |
| Lifbe | every 1 hours |
Volumetry
Table below presents data consumption with a heavy configuration:
| Protocol | Sampling | Hourly consumption | Daily consumption | Montly consumption |
|---|---|---|---|---|
| TWAMP | 30 / min | 0.1 Mb | 2.4 Mb | 74.4 Mb |
| ICMP | 30 / min | 0.2 Mb | 4.8 Mb | 148.8 Mb |
| HTTP | 30 / min | 0.5 Mb | 12 Mb | 372 Mb |
| HTTPs | 30 / min | 0.6 Mb | 14.4 Mb | 446.4 Mb |
| TCP | 30 / min | 0.4 Mb | 9.6 Mb | 297.6 Mb |
| UDP | 30 / min | 0.4 Mb | 9.6 Mb | 297.6 Mb |
Other protocols
| Protocol | Sampling | Hourly consumption | Daily consumption | Montly consumption |
|---|---|---|---|---|
| TraceRoute | 4 / hour | 2.2 Kb | 53 Kb | 1.7 Mb |
| Iperf3 | 12 / day | 83 Mb | 2 Gb | 62 Gb |
| Lifbe | 6 / hour | 25.8 Mb | 619.2 Mb | 18.6 Gb |
| PacketLoss | 12 / min | 4.3 Mb | 104.2 Mb | 3.1 Gb |
Data locations
Influx and Grafana databases can be accessed on the analyzer host
| Application | Location |
|---|---|
| Grafana | lti_analyzer/grafana/grafana/grafana.db |
| Influx | lti_analyzer/influx/data/* |
Backups
Backup can be made by simply copying the files on a desired location, or setting up a process reading the databases.
Extending dashboards
Additional dashboards can be created. Contact your Latence Technologies' vendor for more information about it.
Use a secure DNS instead of an IP address for your analyzer
If you want to add an nginx server to your analyzer to be able to go and use a DNS address, follow these steps:
Create the server
You need :
A DNS A Record pointed at your analyzer’s public IP. This will be configured with Nginx to proxy your application server. In our example it will be demo.domain.com
The address of the application server you want to proxy. In our case it will be `http://127.0.0.1:12021).
Step 1 — Installing Nginx
sudo apt update
sudo apt install nginx
systemctl status nginx
Step 2 — Configure the Server Block
It is recommended practice to create a custom configuration file for your new server block additions, instead of editing the default configuration directly. Create and open a new Nginx configuration file using nano or your preferred text editor:
sudo nano /etc/nginx/sites-available/demo.domain.com
Copy the following block and paste it in your config file, don't forget to modify the "demo.domain.com" with the DNS A Record you assigned to your analyzer.
server {
listen 80;
listen [::]:80;
server_name demo.domain.com;
location / {
proxy_pass http://127.0.0.1:12021;
include proxy_params;
}
}
Next, enable this configuration file by creating a link from it to the sites-enabled directory that Nginx reads at startup:
sudo ln -s /etc/nginx/sites-available/demo.domain.com /etc/nginx/sites-enabled/
You can now test your configuration file for syntax errors:
sudo nginx -t
With no problems reported, restart Nginx to apply your changes:
sudo systemctl restart nginx
Add TLS/SSL Certificates
Step 1— Installing Certbot
sudo apt install certbot python3-certbot-nginx
Step 2 — Confirming Nginx’s Configuration
If you followed the tutorial above then you should have a server block for your domain at /etc/nginx/sites-available/example.com with the server_name directive already set appropriately, feel free to jump to Step 3.
To check, open the configuration file for your domain using nano or your favorite text editor:
sudo nano /etc/nginx/sites-available/demo.domain.com
Find the existing server_name line. It should look like this:
...
server_name demo.domain.com;
...
If it does, exit your editor and move on to the next step. If it doesn’t, update it to match. Then save the file, quit your editor, and verify the syntax of your configuration edits:
sudo nginx -t
If you get an error, reopen the server block file and check for any typos or missing characters. Once your configuration file’s syntax is correct, reload Nginx to load the new configuration:
sudo systemctl reload nginx
Certbot can now find the correct server block and update it automatically.
Next, let’s update the firewall to allow HTTPS traffic.
Step 3 — Obtaining an SSL Certificate
Certbot provides a variety of ways to obtain SSL certificates through plugins. The Nginx plugin will take care of reconfiguring Nginx and reloading the config whenever necessary. To use this plugin, type the following:
sudo certbot --nginx -d demo.domain.com
This runs certbot with the --nginx plugin, using -d to specify the domain names we’d like the certificate to be valid for.
If this is your first time running certbot, you will be prompted to enter an email address and agree to the terms of service. After doing so, certbot will communicate with the Let’s Encrypt server, then run a challenge to verify that you control the domain you’re requesting a certificate for.
Step 4 — Verifying Certbot Auto-Renewal
Let’s Encrypt’s certificates are only valid for ninety days. This is to encourage users to automate their certificate renewal process. The certbot package we installed takes care of this for us by adding a systemd timer that will run twice a day and automatically renew any certificate that’s within thirty days of expiration.
You can query the status of the timer with systemctl:
sudo systemctl status certbot.timer
To test the renewal process, you can do a dry run with certbot:
sudo certbot renew --dry-run
If you see no errors, you’re all set. When necessary, Certbot will renew your certificates and reload Nginx to pick up the changes. If the automated renewal process ever fails, Let’s Encrypt will send a message to the email you specified, warning you when your certificate is about to expire.