Introduction
This documentation explains how to install and operate Latence Technologies' real-time cloud analytics solution for cellular networks with a special focus on ultra-low latency connectivity.
Every millisecond counts!
Solution architecture
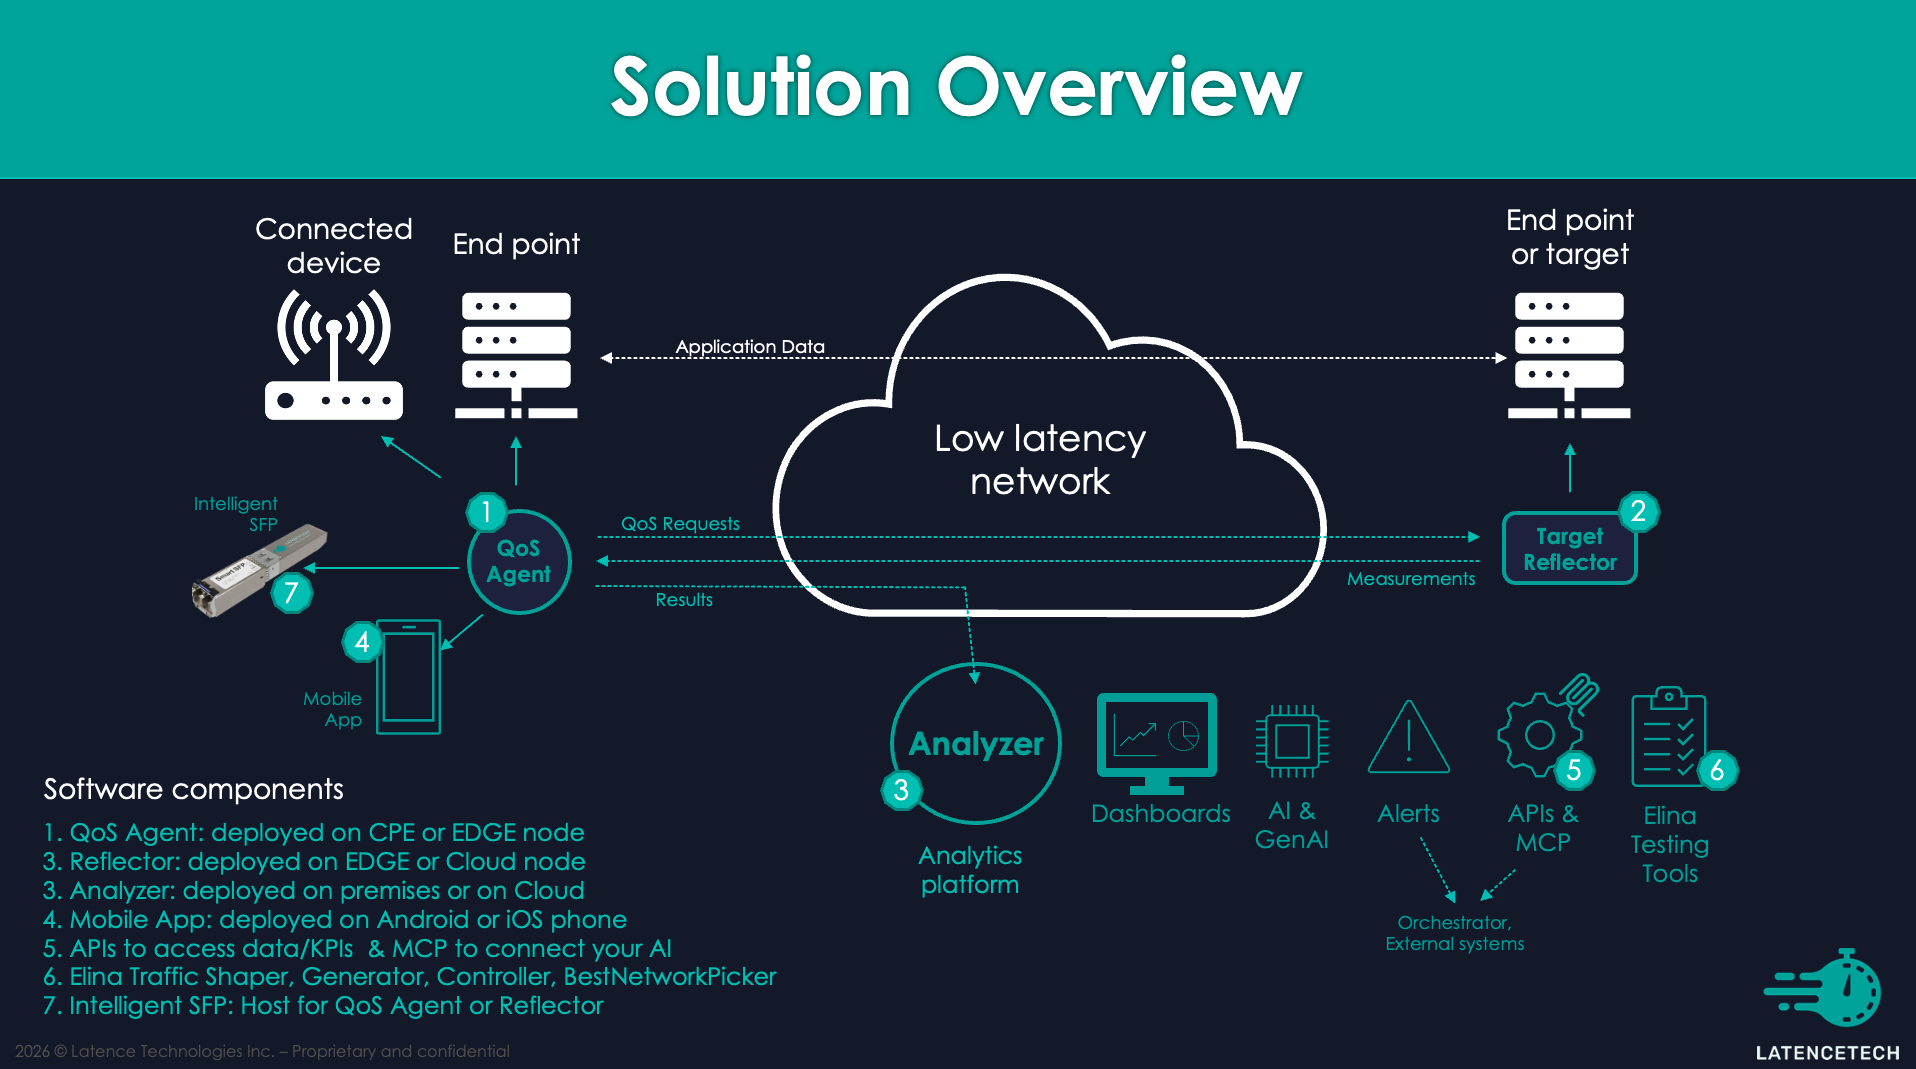
The solution is composed of 3 components.
- A QoS-Agent that will probe the network and send the results to the analyzer.
- A Reflector, acting as the target for the probes.
- An Analyzer that gathers and processes the data and deliver insights into your network connectivity.
These components are deployed as docker containers, work on a large variety of hosts and can be tailored to fit specific network configurations. The picture below illustrate this architecture, with an example of dashboard.
Note: A reflector can respond to multiple agents and an analyzer can receive data from multiple agents. It is important to make sure that each agent has its own agent ID (LTI_agent_id), so that the data are differenciated in the analyzer. It will be possible to display the data of every site by selecting the agent ID in grafana.
Main open-source components
Here is a table of the 4 main open source components that we are using.
| Component | Version | Link |
|---|---|---|
| Grafana | 12.4.2 | https://grafana.com/ |
| InfluxDB | 2.8.0 | https://www.influxdata.com/ |
| Kafka | 8.2.0 | https://kafka.apache.org/ |
| Telegraf | 1.38 | https://github.com/influxdata/telegraf |