Dashboard explanations
Once your are in the Grafana: http://YOUR_ANALYZER_HOST_IP:12021, you can connect to it as a viewer with the credentials provided by the onboarding LT team.
These default credentials must be changed on the first use for security reasons.
It is also possible to connect with other roles if needed: admin and editor. If you want to have access to those roles, contact your Latence Technologies vendor.
Content
Once connected, you will have access this tools:
- Network status summary
- Detailed latency charts
- Latency forecast
- Latency Heatmap
- Agent Status
- Packet Loss
- Bandwidth
- LIFBE
- Multi-agent comparison
- Network and Radio data dashboard
- Quality Of Experience
- Historical Events Insights
- Historical KPI Insights
- Analyzer Monitoring
Dashboard Menu
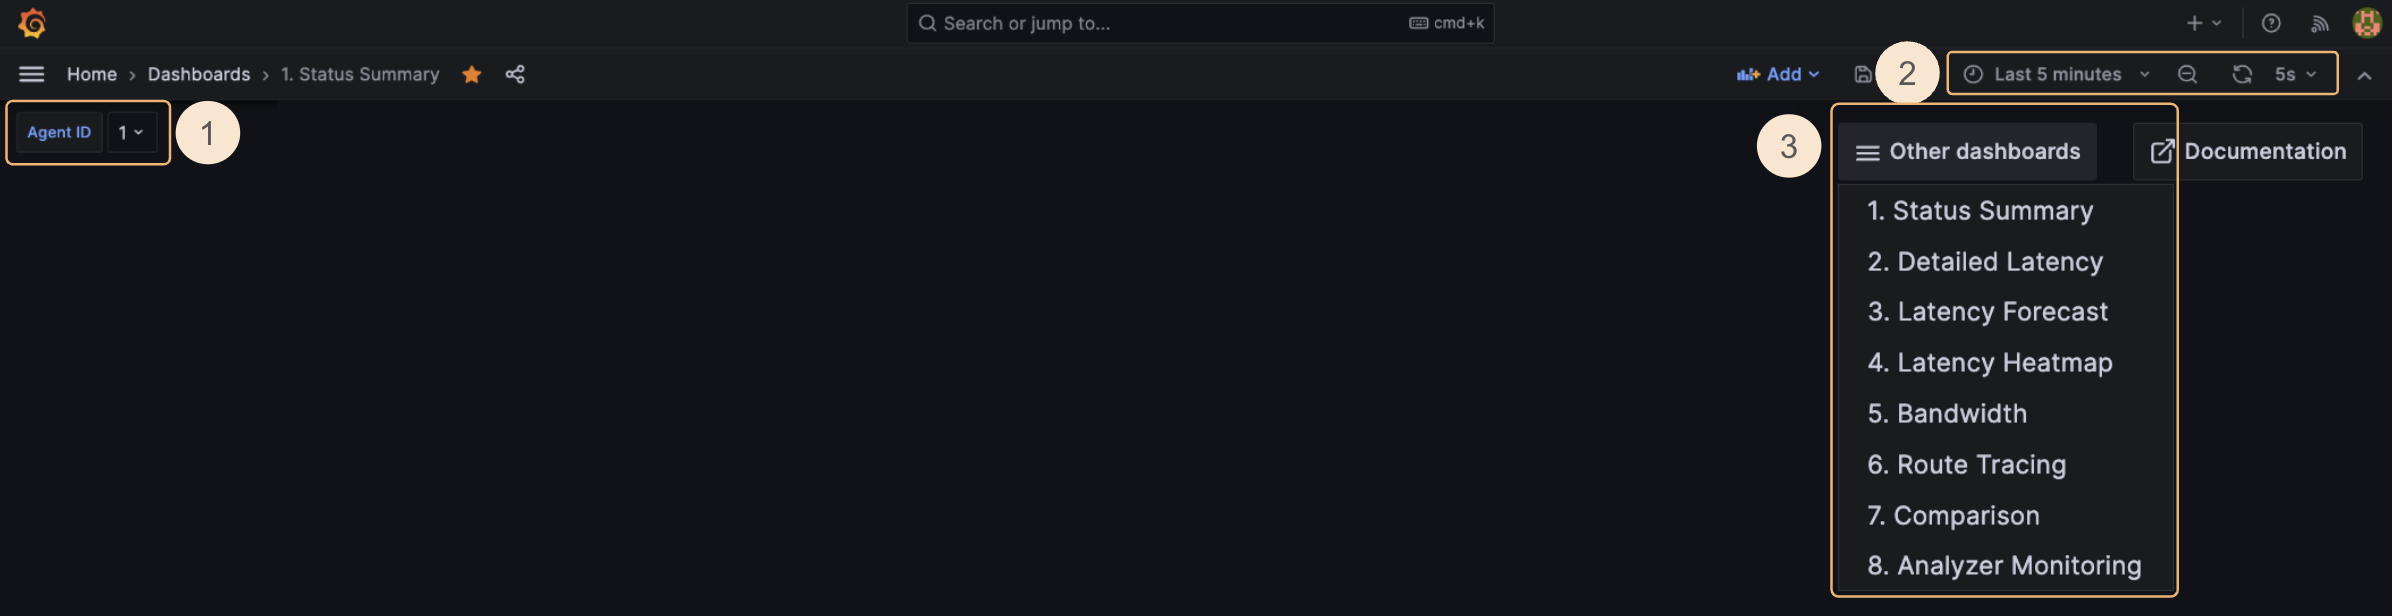
For all dashboards, we can select the customer ID for which we want to filter the agents (1).
Similarly, we can select the agent for which we want to see all the data (2).
Besides, it is possible to change the time range and the refresh rate using the top menu (3).
You can navigate to other dashboards by clicking on their corresponding icon (4).
Network Status Summary
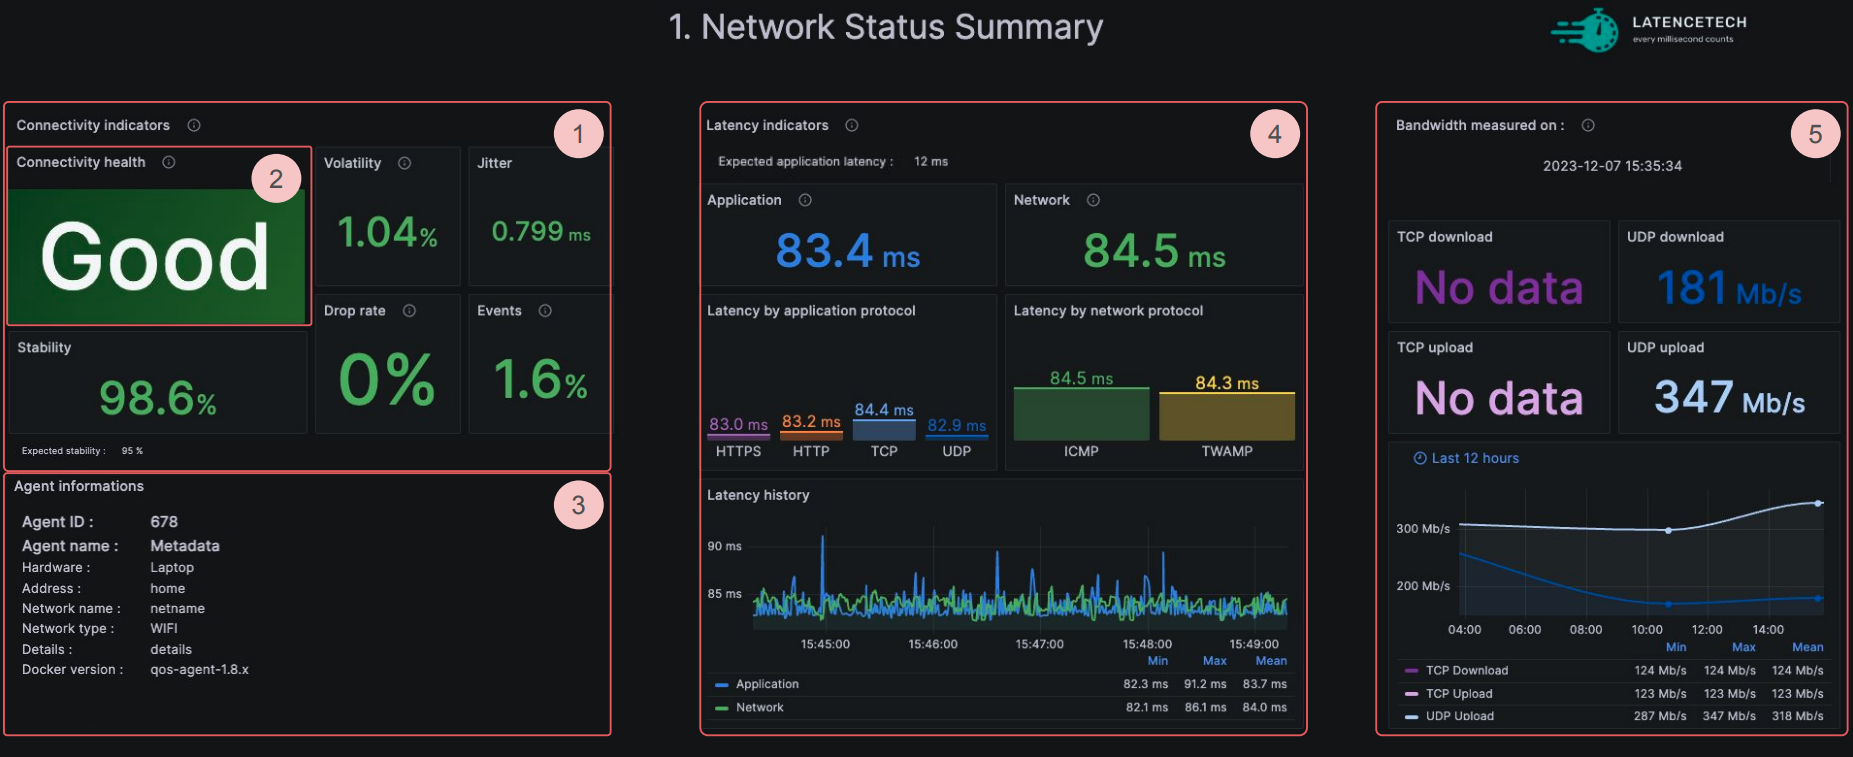
On this compact dashboard above, we can see the main information for our network before seeing the details in the other dashboards.
First, make sure that the agent ID selected is the one for which you wish to view data (see it here).
We can analyze the following data:
- Connectivity quality indicators (1)
- Stability: the network stability is computed based on standard deviation, drops, and events.
- QoE: a value out of 5 signifying the Quality of Experience estimated by using latency, jitter, and packet loss
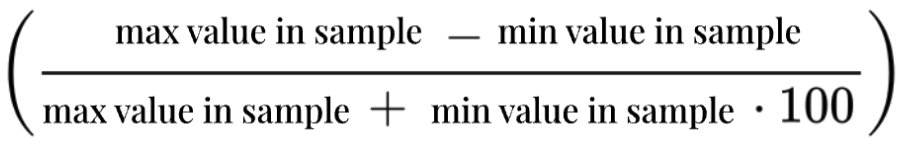
- Volatility: the volatility is calculated using the maximum and minimum values in the data range. Having a low volatility means that we have a stable network.
Volatility formula:
- Download packet loss rate: number of lost packets divided by the number of measurements during the time range selected for download.
- Upload packet loss rate Rate: number of lost packets divided by the number of measurements during the time range selected for upload.
- Jitter: variation in time delay between when a signal is transmitted and received over a network connection, measuring the variability in latency. The formula is ( mean(abs(differences between values)) / mean(values) ) * 100. It analyzes all the values in the time range selected.
Example:
Let’s say we have 5 samples with the following latencies: 136, 184, 115, 148, 125 (in that order). The average latency is 142 - (add them, divide by 5). The jitter is calculated by taking the difference between samples.
136 to 184, diff = 48
184 to 115, diff = 69
115 to 148, diff = 33
148 to 125, diff = 23
(Notice how we have only 4 differences for 5 samples). The total difference is 173 and mean differnce is 173 / 4 or 43.25 - so the jitter is ( 43.25 / 142 ) * 100, or 30.45.
- Connectivity Health indicator (2)
- This high level indicator takes into consideration stability, volatility, application latency and the threshold set in the agents (expected application latency and expected stability that must be defined at launch by user, 30 ms and 95% otherwise).
- It can indicate Good when the stability and latency thresholds are respected, Warning when one of the previous condition is not respected and Need attention as soon as the stability and latency thresholds are not respected with a 20% margin.
- Agent informations (3) are some of the metadatas about the selected agent.
- Agent ID: Unique identifier for the device that is collecting data.
- Agent Name: Agent or site name. Must be defined at launch by user, empty otherwise.
- Hardware: Type/model of equipment where the agent is installed. Must be defined at launch by user, empty otherwise.
- Address: Agent's physical address. Must be defined at launch by user, empty otherwise.
- Network name: Name of the network used by the probe to reach the reflector (if applicable). Must be defined at launch by user, empty otherwise.
- Network type: Network type used (4G, 5G, WIFI, etc). Must be defined at launch by user, empty otherwise.
- Details: Raw text field for more details about this agent. Must be defined at launch by user, empty otherwise.
- Docker version: Version of the QoS-Agent used.
- Network Signal Information (3) is network information applicable only if the selected agent is mobile.
- Agent ID: Unique identifier for the device that is collecting data.
- Network: Name of the mobile network used by the probes to reach the reflector.
- Network type: Network type used (4G, 5G, WIFI, etc).
- Cell Identity (NCI/ECI): Unique identifier for a cell tower in a mobile network.
- Physical Cell ID (PCI): Physical layer cell identifier in 4G LTE and 5G NR used to indicate the physical identity of a cell during the cell selection procedure.
- RSSI: Received Signal Strength Indicator, representing total received power.
- SINR: Signal-to-Interference-plus-Noise Ratio, measuring signal quality.
- RSRQ: Reference Signal Received Quality, measuring signal quality relative to RSRP.
- RSRP: Reference Signal Received Power, indicating signal strength in LTE networks.
- Latency indicators (4)
- Application: the application latency is the mean of the HTTP, HTTPs, TCP and UDP latencies.
- Expected application latency: correspond to the threshold the user created when initializing the agent
- Network: the network latency is the mean between ICMP and TWAMP latencies.
- Latency by protocol
- Latency history
- Bandwidth indicators (5)
- Bandwidth data with TCP and UDP upload speed and download speed.
- The bandwidth history data over the last 12 hours.
Detailed latency charts
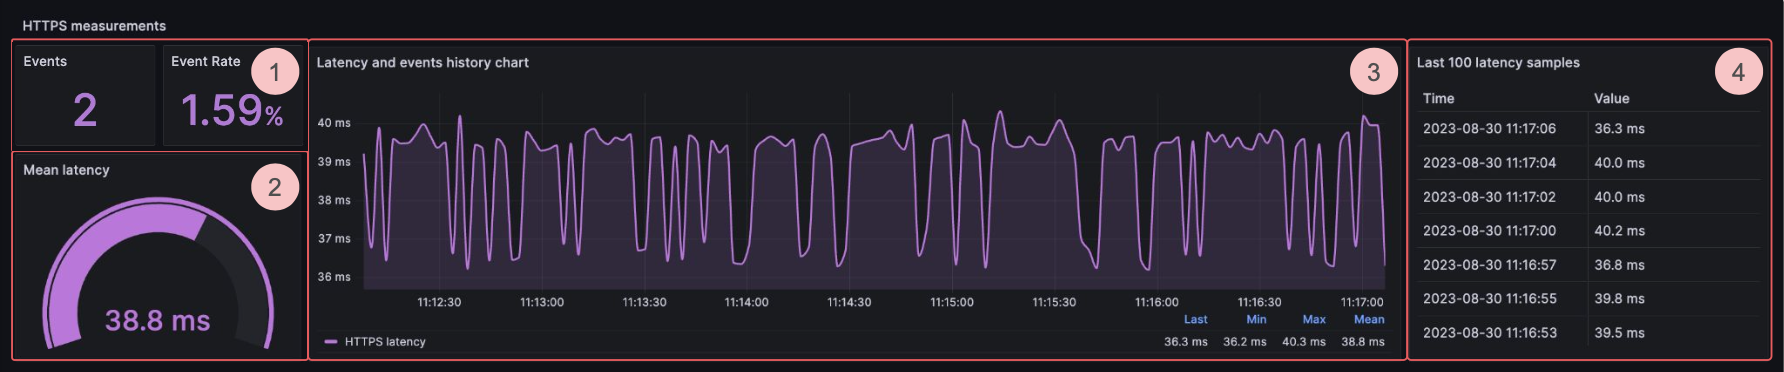
On this detailed latency chart dashboard above, we can see the detailed information of latency for each protocol.
First, make sure that the agent ID selected is the one for which you wish to view data (see it here).
Then you can analyze the following data:
- The number of Events and Event rate for each protocols (1): unexpected pattern in the QoS. This event rate is the number of events divided by number of measurements during the time range selected.
- The mean latency for each protocols for the selected time range (2).
- A chart (3) in which we can see the history for the time range selected of the latency and the Events marked with a red and brown dots.
- Events marked in red are identified using the Median Absolute Deviation (MAD) method. This involves calculating the median of the dataset, then computing the absolute deviation of each data point from that median. The MAD is the median of these deviations. Any value that deviates from the median by more than 7 times the MAD is flagged as a red anomaly.
- The events marked in brown are distribution anomalies, detected when there is a significant shift in the average level (mean) of the data or a notable change in volatility, measured by the inter-quartile range (IQR).
- The last 100 latency samples (4).
- For the TWAMP protocol, you can also see the latency decomposed between the time for a roundtrip and the time for processing.
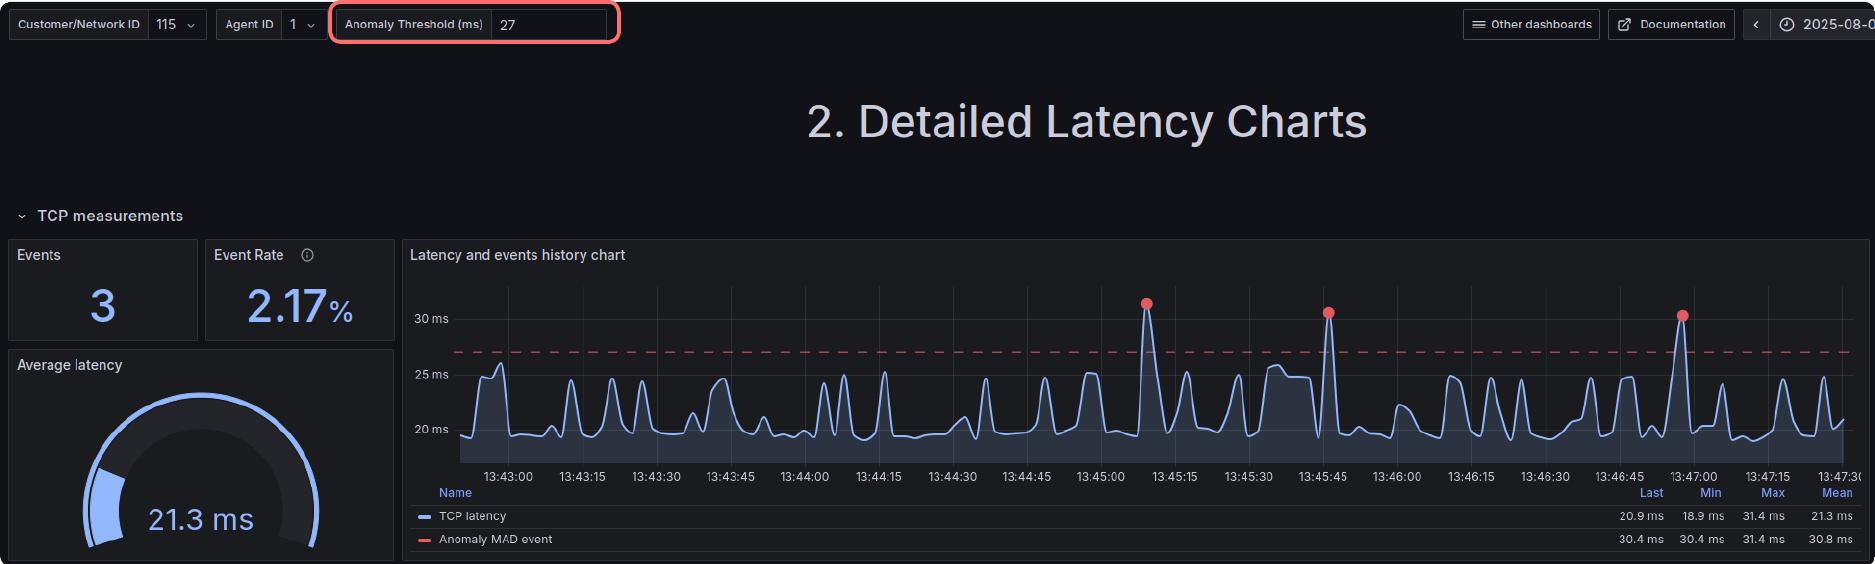
You can filter out red anomaly events (median absolute deviation method) by setting an optional threshold in the Anomaly Threshold (ms) textbox, measured in milliseconds. Events below this threshold will be excluded.
Latency forecasting
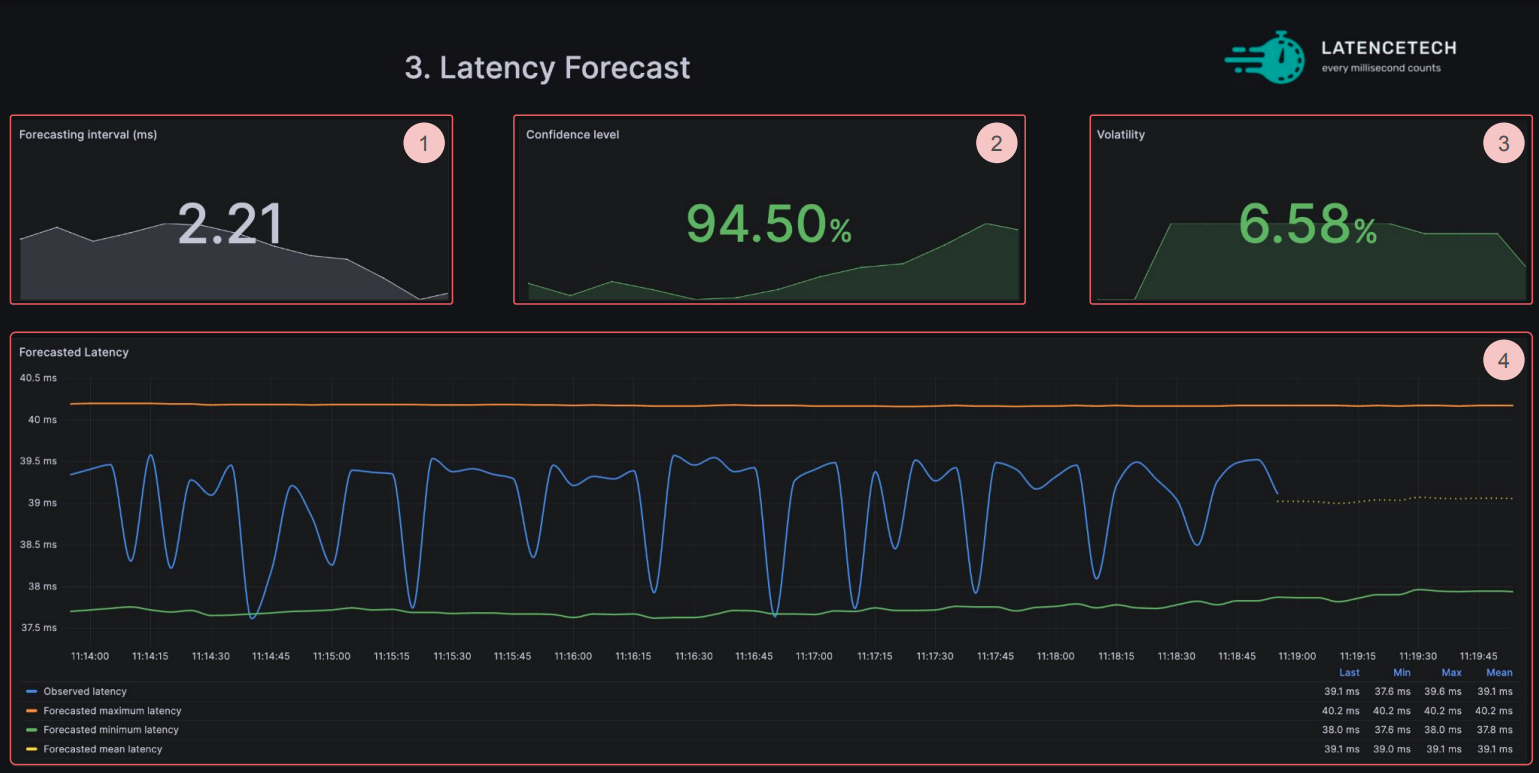
On the Latency forecasting dashboard above, we can see charts given by a statistical model.
First, make sure that the agent ID selected is the one for which you wish to view data (see it here).
After, you can analyze the following data:
- The predicted latency after 30s using exponential smoothing (1).
- The latency forecast interval, in milliseconds (2).
- The confidence level of the forecasting (3).
- The current latency compared to the forecasted one for the last 5 minutes and the forecasted latency for the next 30 seconds (4).
Latency Heatmap
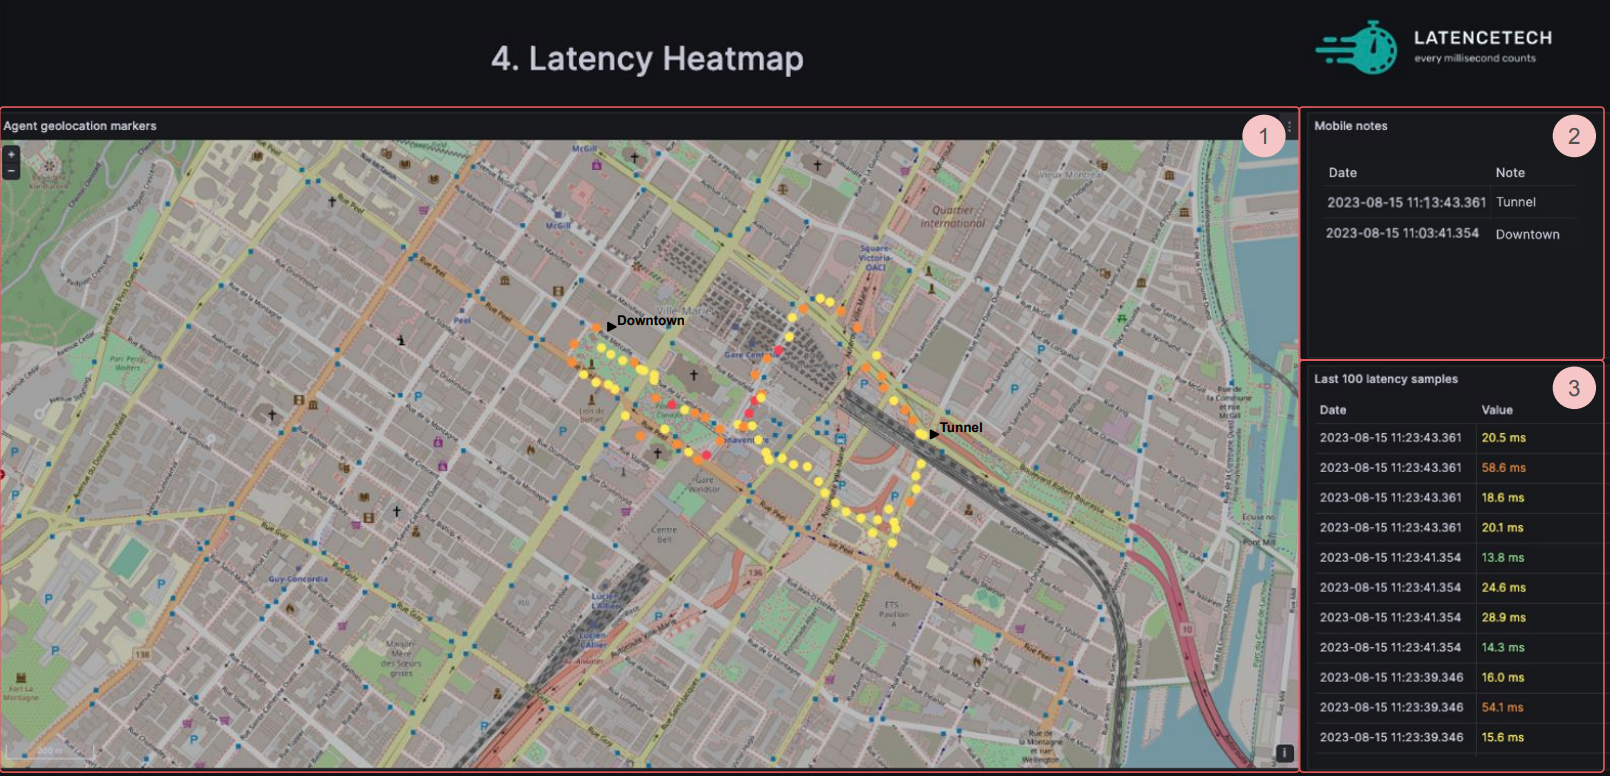
On this heatmap dashboard, we can visualize the latency measurement in space gathered by a QoS-Agent in motion (for example with the MobileLatency app).
First, make sure that the agent ID selected is the one for which you wish to view data (see it here).
Then you can analyze the following data:
- The heatmap created by the QoS-agent in motion (1).
- The details of the notes created from the MobileLatency app (2).
- The last 100 latency samples (3).
Agent Status
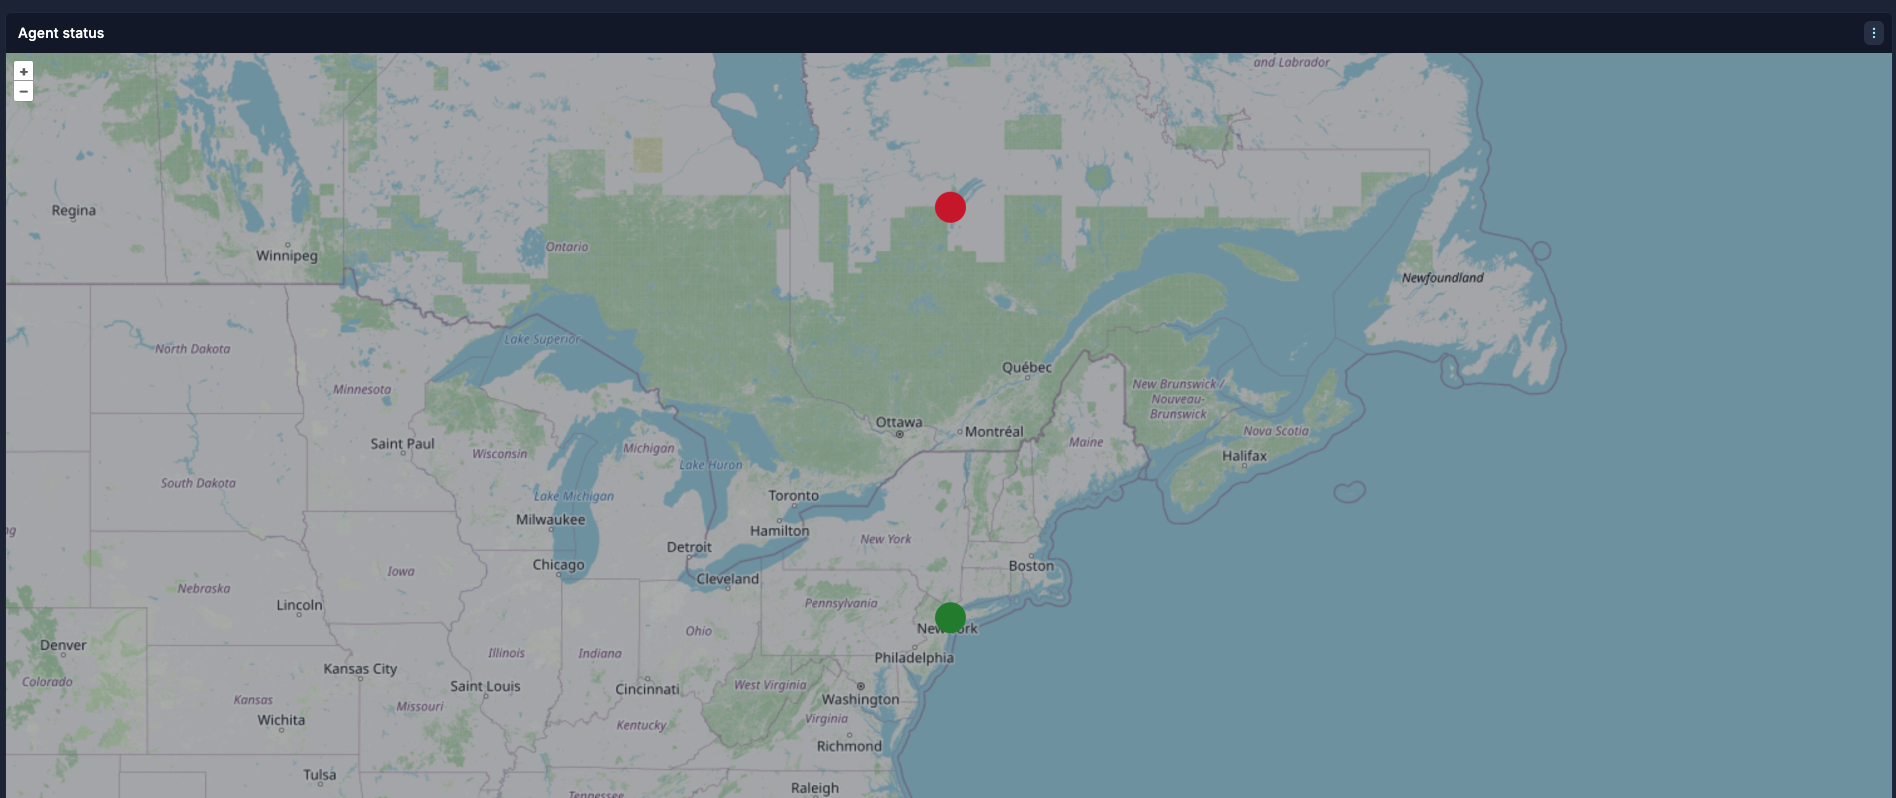
The agent status page displays the status of the agent on the map as red or green dots depending on whether it is active.
Packet Loss
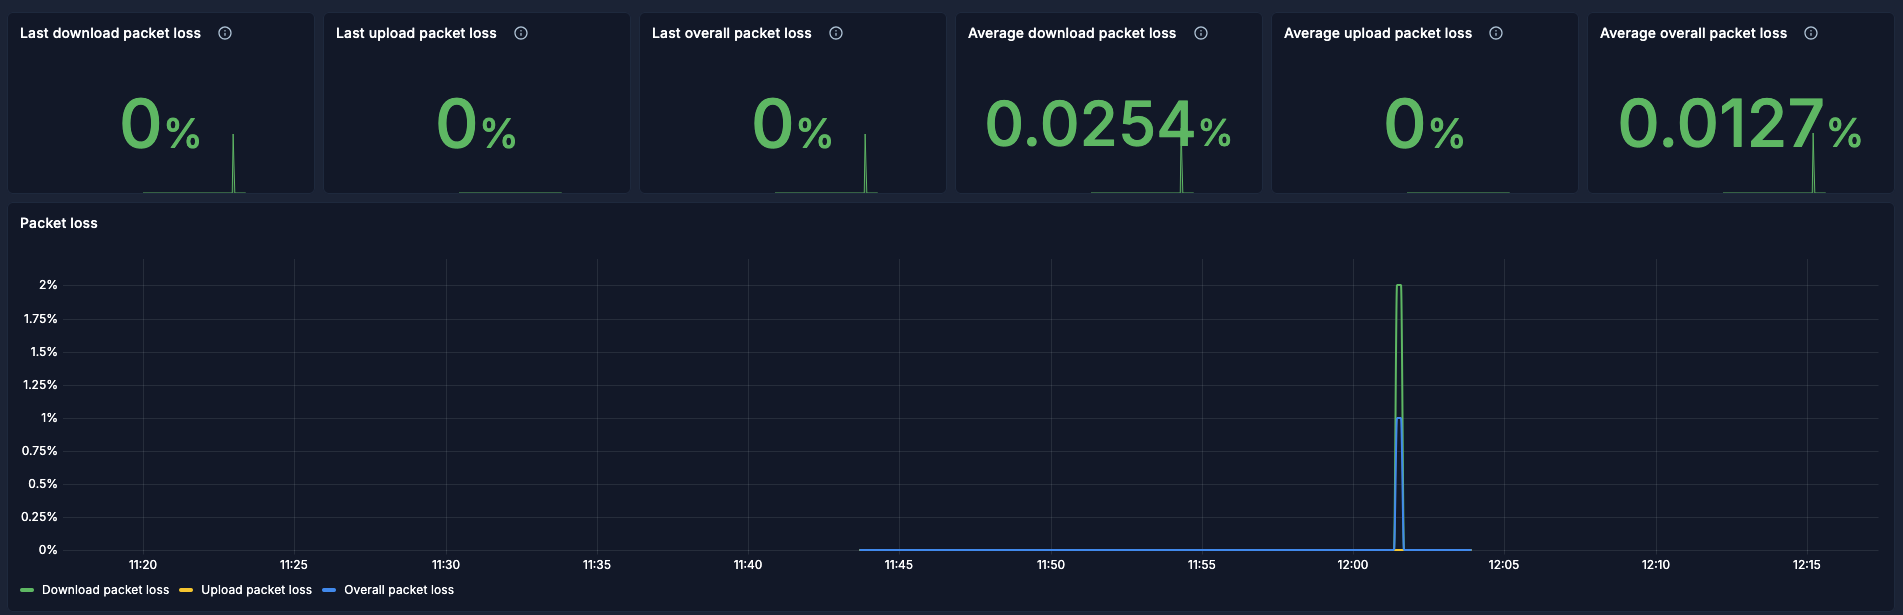
The Packet Loss probe use minimal UDP packets to measure network packet loss rate in both direction independently (upload & download) to give an overview of the packets in the network.
Bandwidth
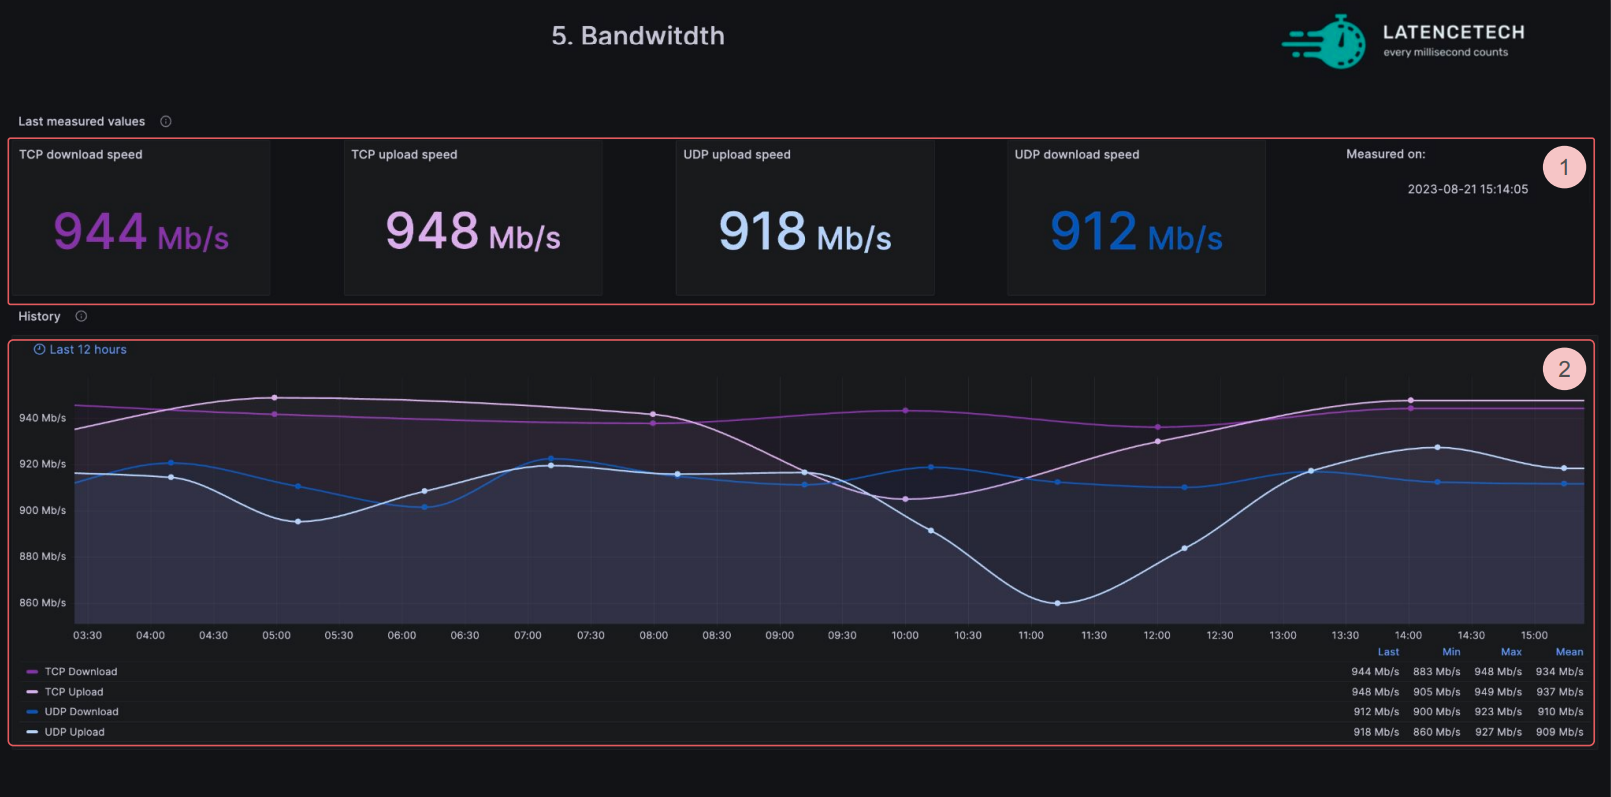
On this bandwidth dashboard, we can see the details of the bandwidth metrics. For measuring bandwidth we use an Iperf tool inside the QoS-Agent.
First, make sure that the agent ID selected is the one for which you wish to view data (see it here).
Then you can analyze the following data:
- Bandwidth data (1) with TCP and UDP upload speed and download speed.
- The bandwidth history data over the last 12 hours (2).
LIFBE
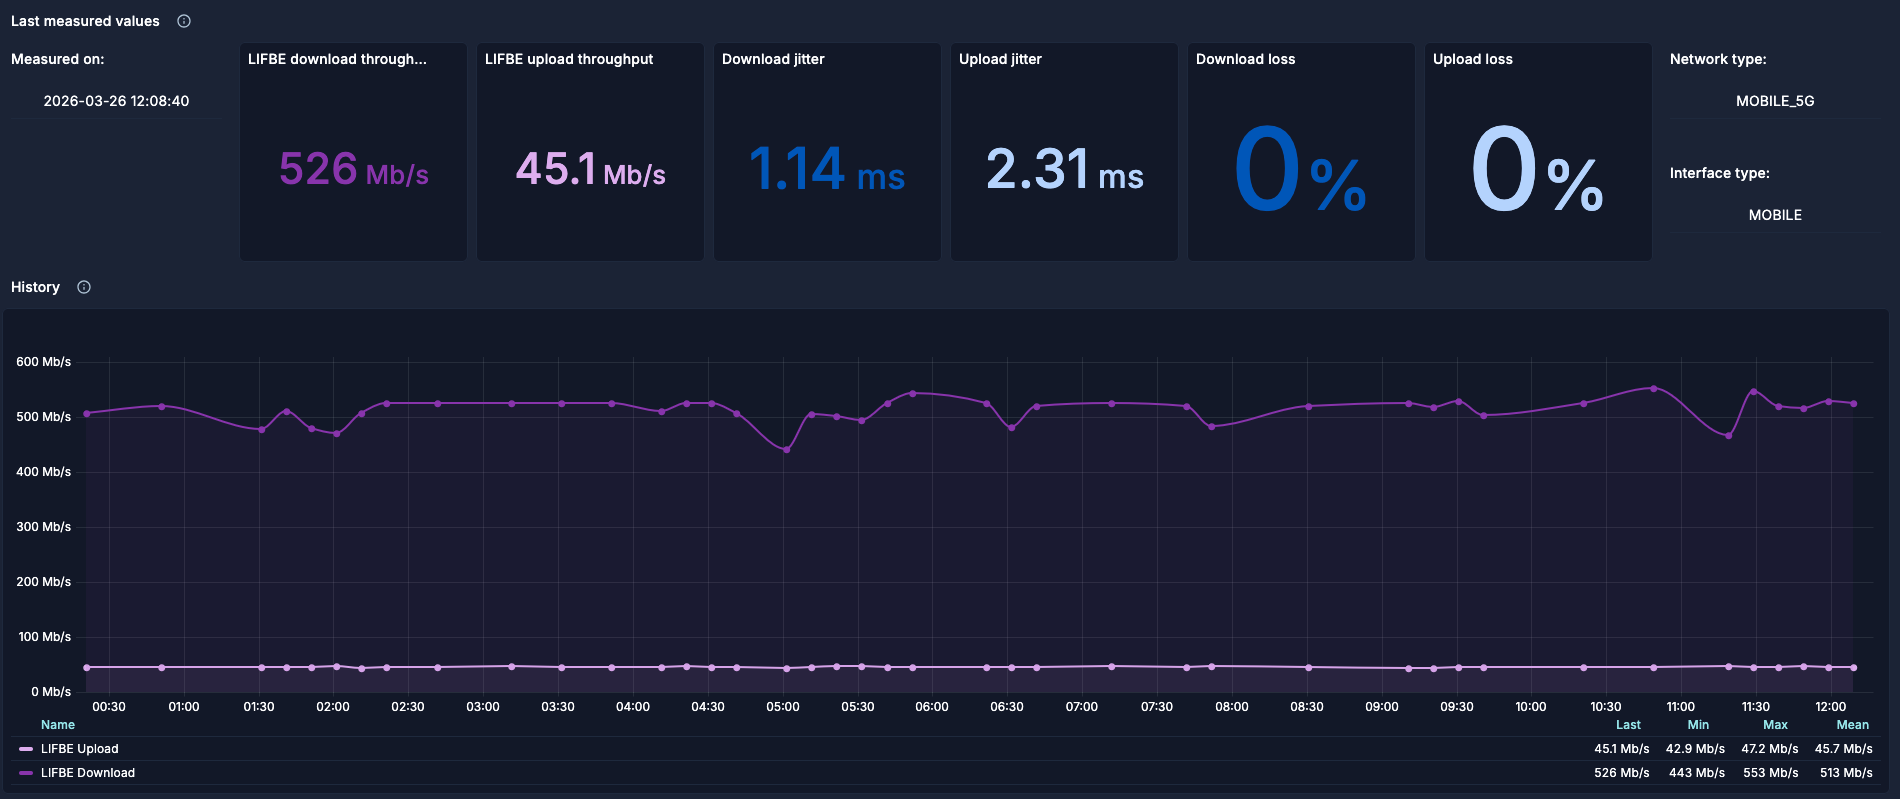
The Lifbe probe is a bandwidth probe using low intrusive process to measure bandwidth on network between a reflector with a static IP address and an agent. On the LIFBE dashboard, we can see the details of the LIFBE metrics.
Multi-agent Comparison
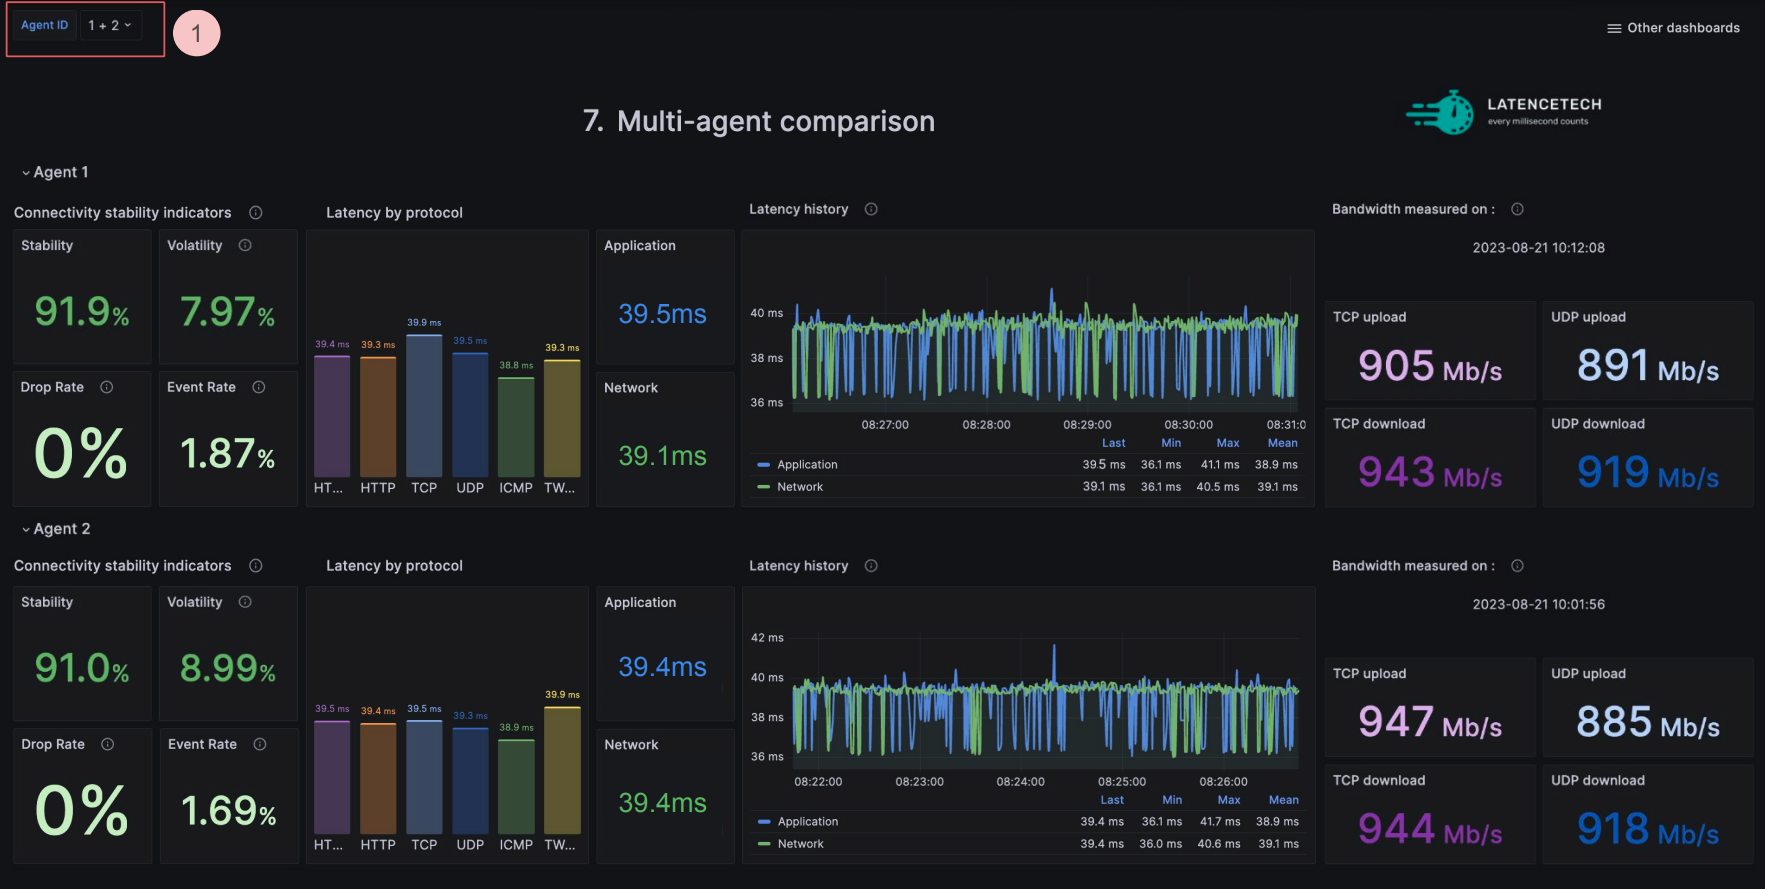
On the Multi-agent comparison dashboard, we can select more than 1 agent ID (1) and display their network informations in order to compare it.
First, select on the top left the agent ID for which you wish to compare data. You can select 1, 2 or more agent ID and their respective panels will appear one below the other.
We can visualize data from the Network Status Summary dashboard as well as data from the Bandwidth dashboard.
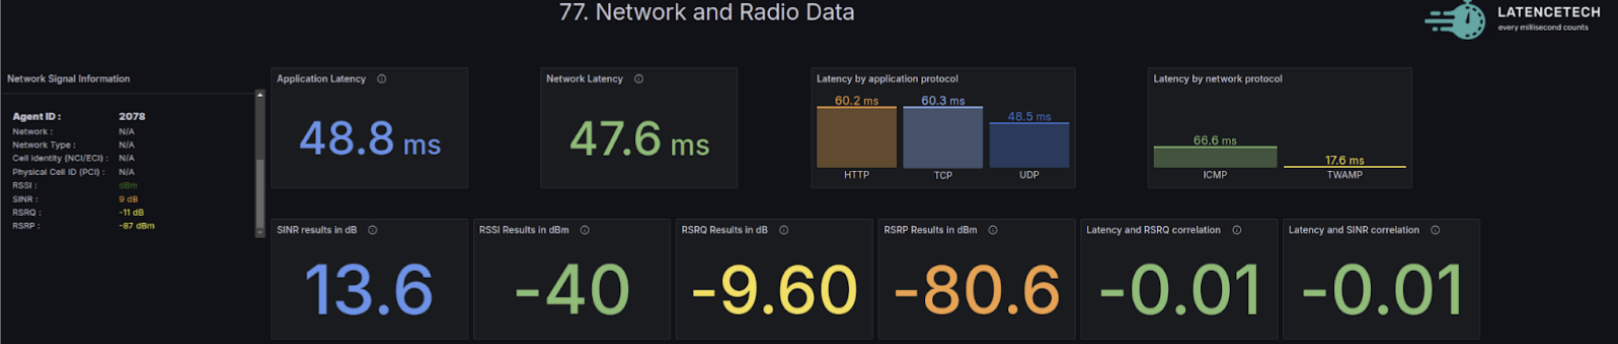
Network and Radio data dashboard
Summary section
- Application latency - This is the mean of the HTTP, HTTPS, TCP, and UDP latencies
- Network latency - This is the mean between ICMP and TWAMP latencies
- Latency and RSRQ correlation - This is the Pearson correlation coefficient between latency (average of all protocols) and RSRQ
- Latency and SINR correlation - This is the Pearson correlation coefficient between latency (average of all protocols) and SINR
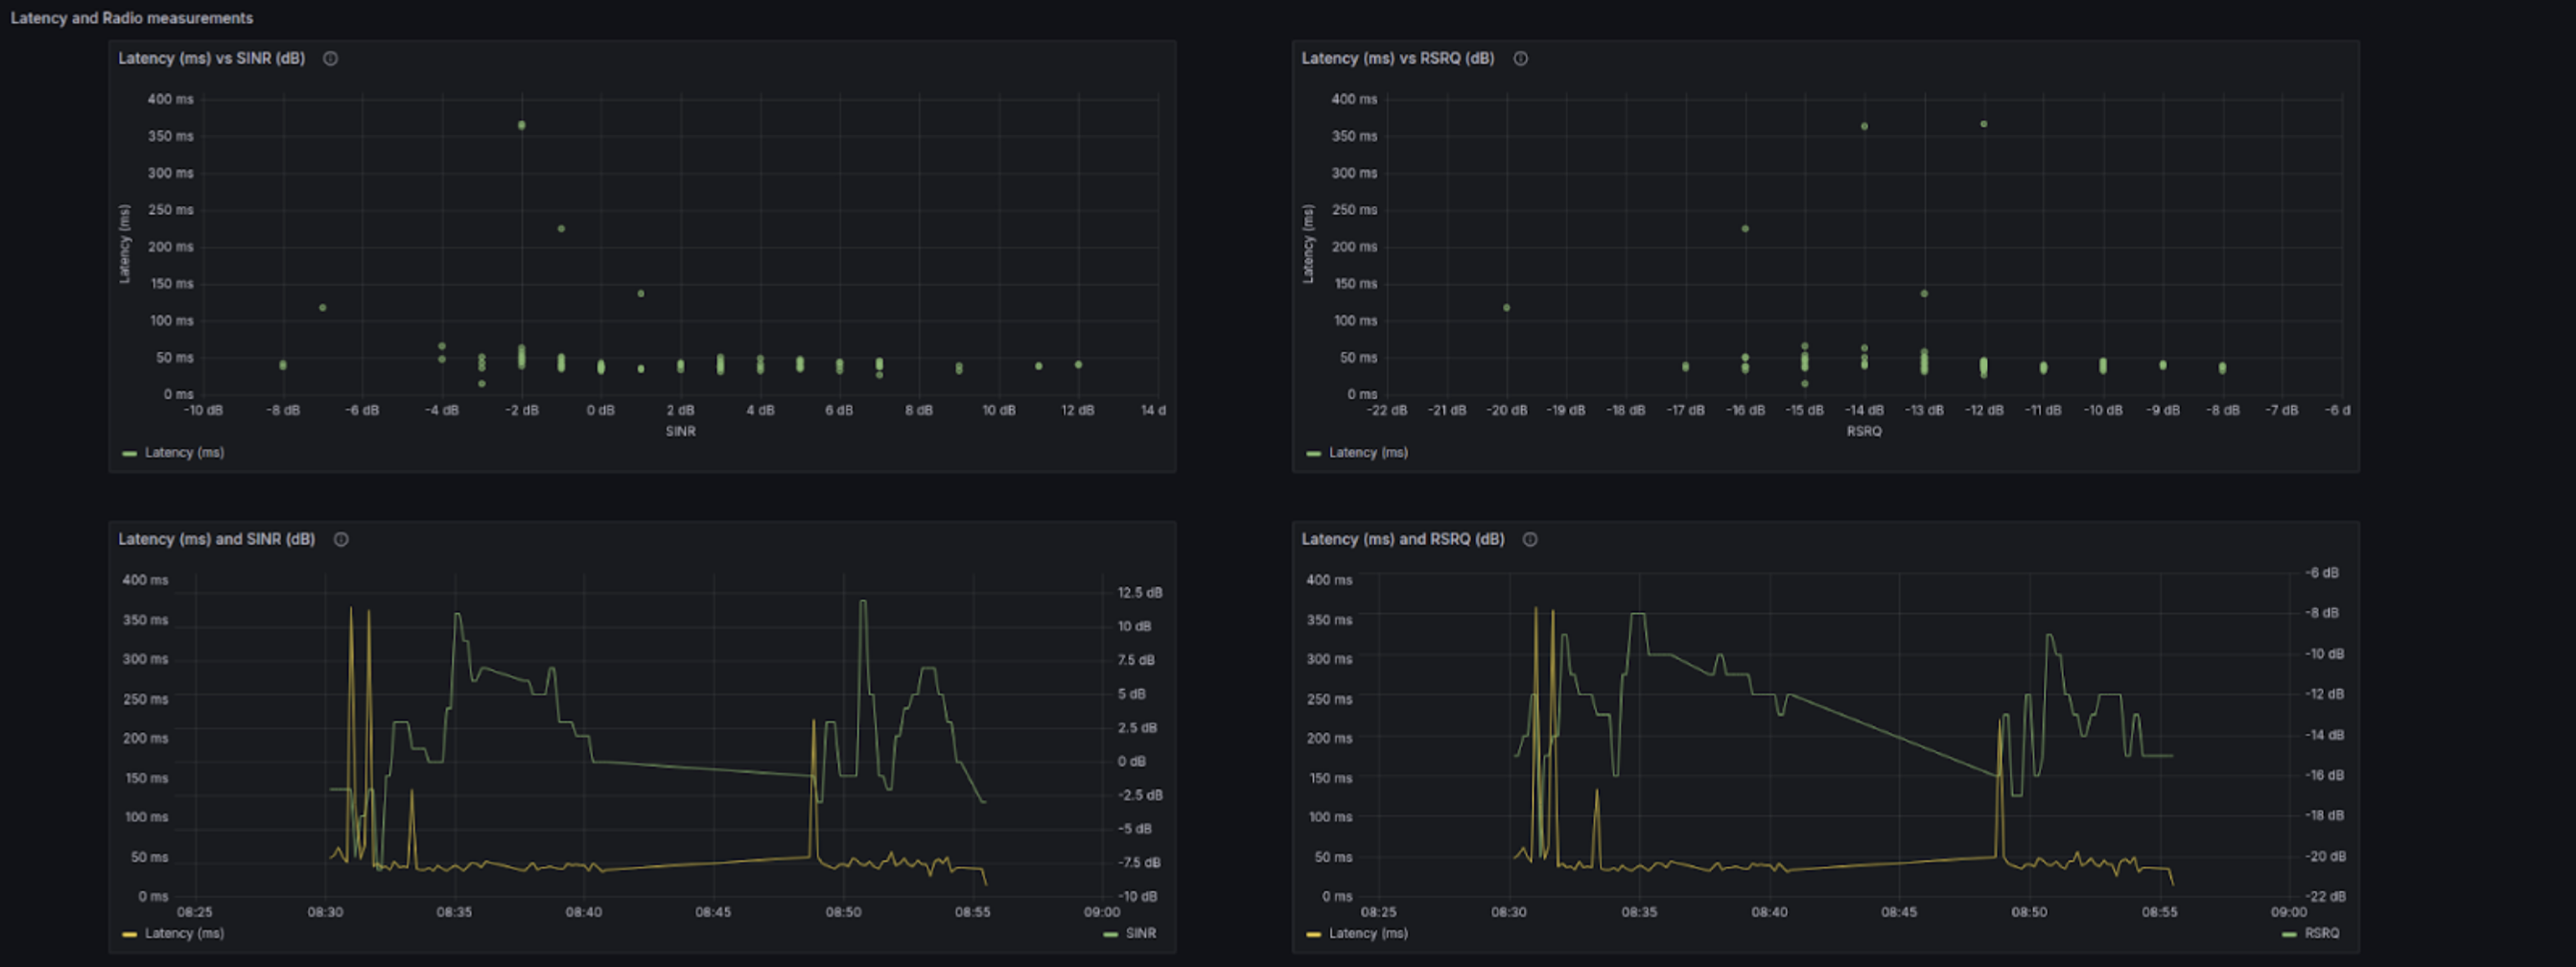
Latency and Radio measurements
- Latency vs SINR - Scatterplot between Latency and SINR with Latency on Y-axis and SINR on X-axis.
- Latency vs RSRQ - Scatterplot between Latency and RSRQ with Latency on Y-axis and RSRQ on X-axis.
- Latency and SINR - Time series plot of Latency and SINR.
- Latency and RSRQ - Time series plot of Latency and RSRQ.
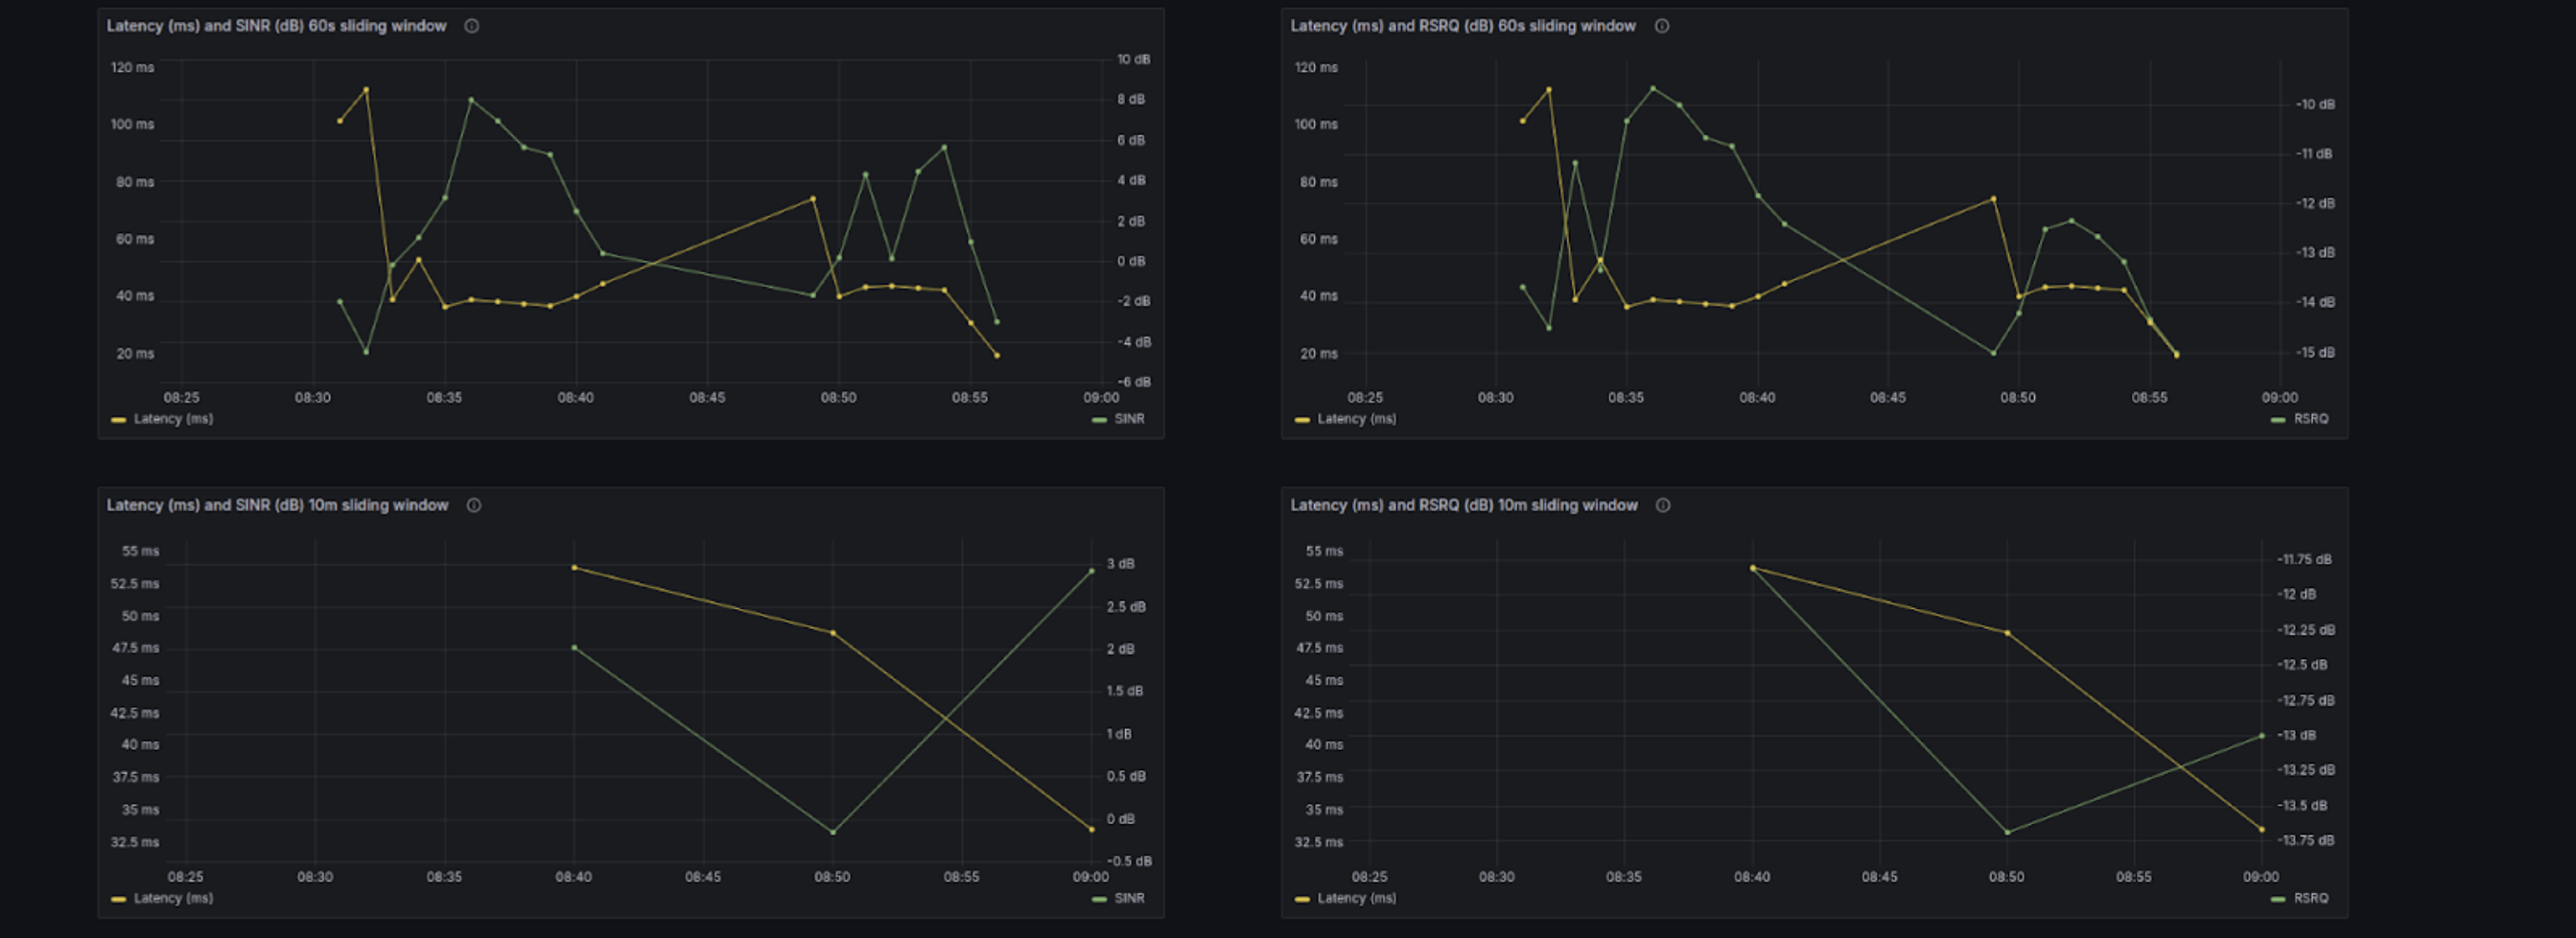
- Latency and SINR 60s window- Time series plot of Latency and SINR aggregated at 60s window
- Latency and RSRQ 60s window- Time series plot of Latency and RSRQ aggregated at 60s window
- Latency and SINR 10-minute window- Time series plot of Latency and SINR aggregated at 10-minute window
- Latency and RSRQ 10-minute window- Time series plot of Latency and RSRQ aggregated at 10-minute window
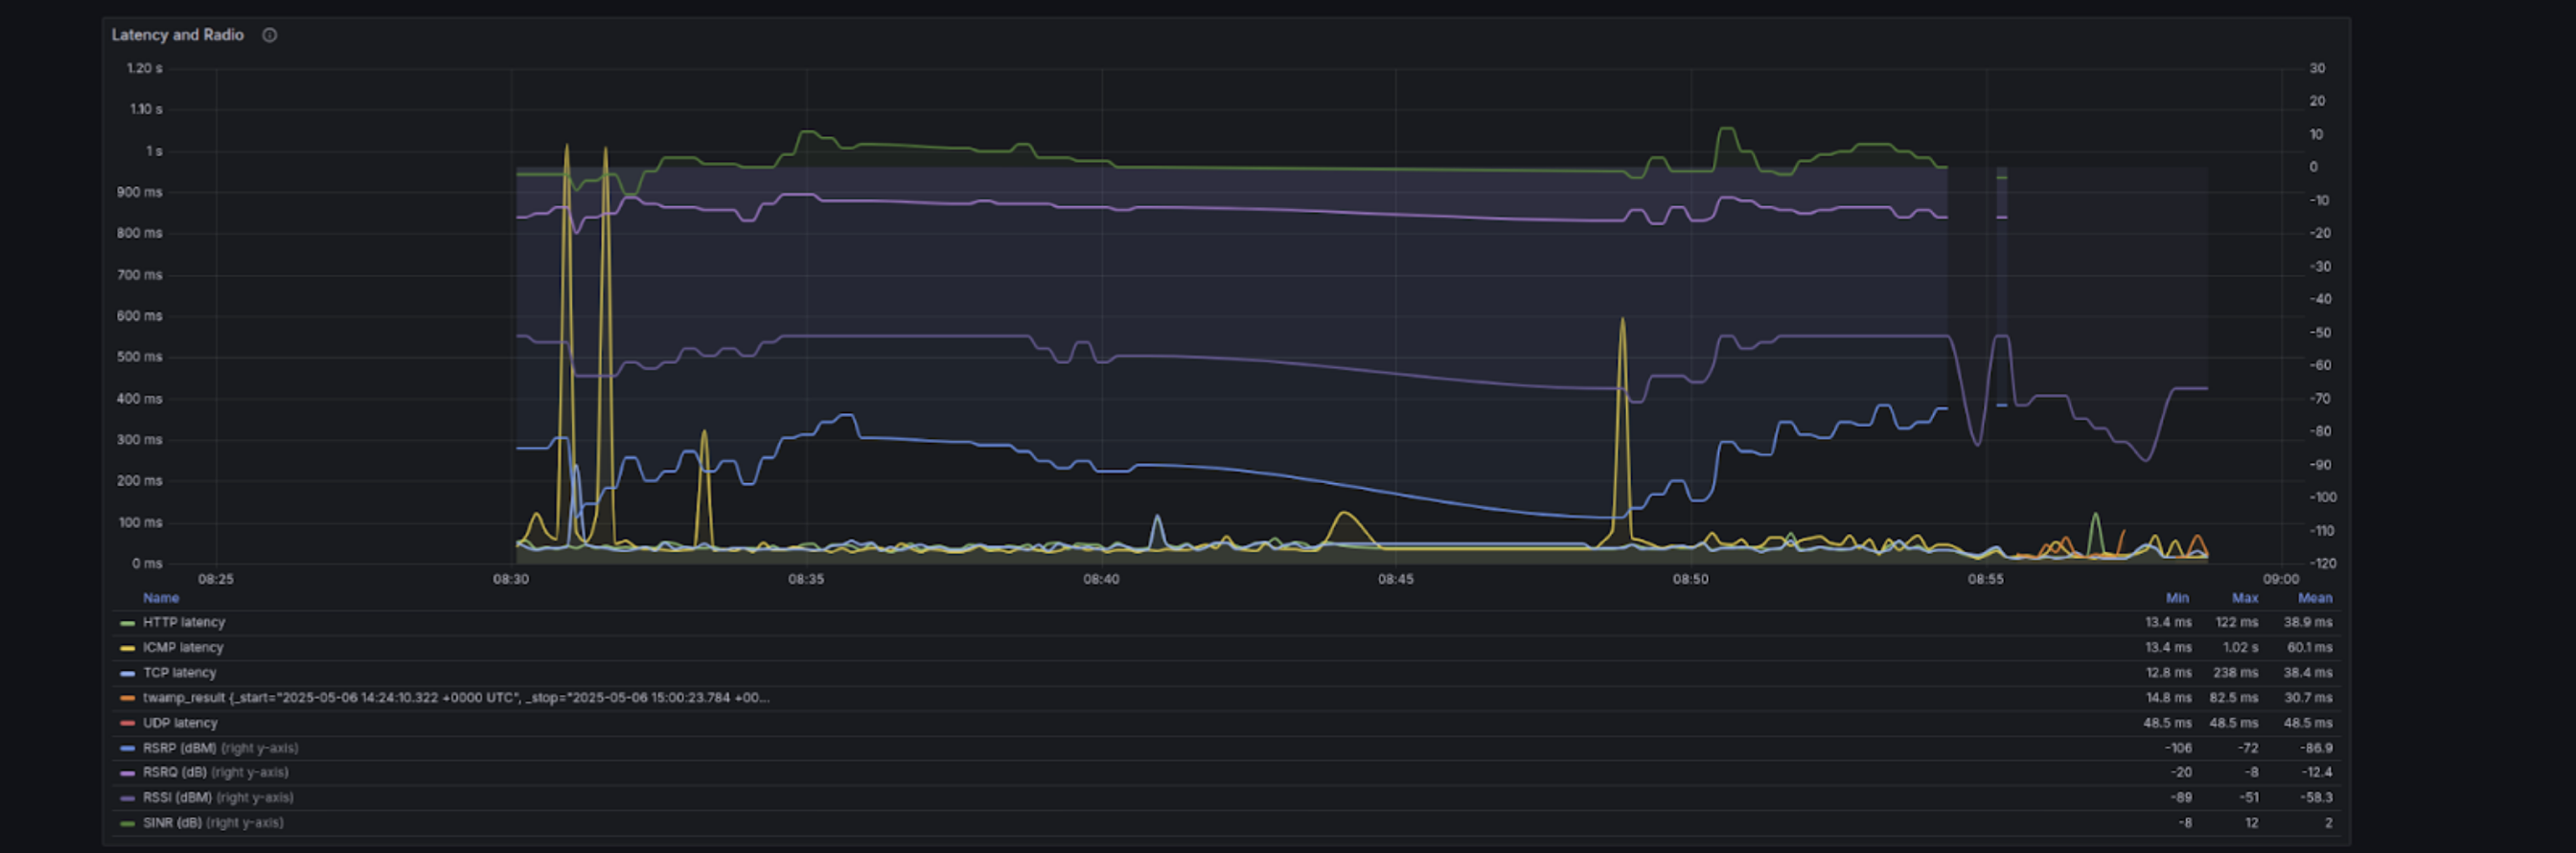
- Latency and Radio - Time series plot of all protocols and radio indicators.
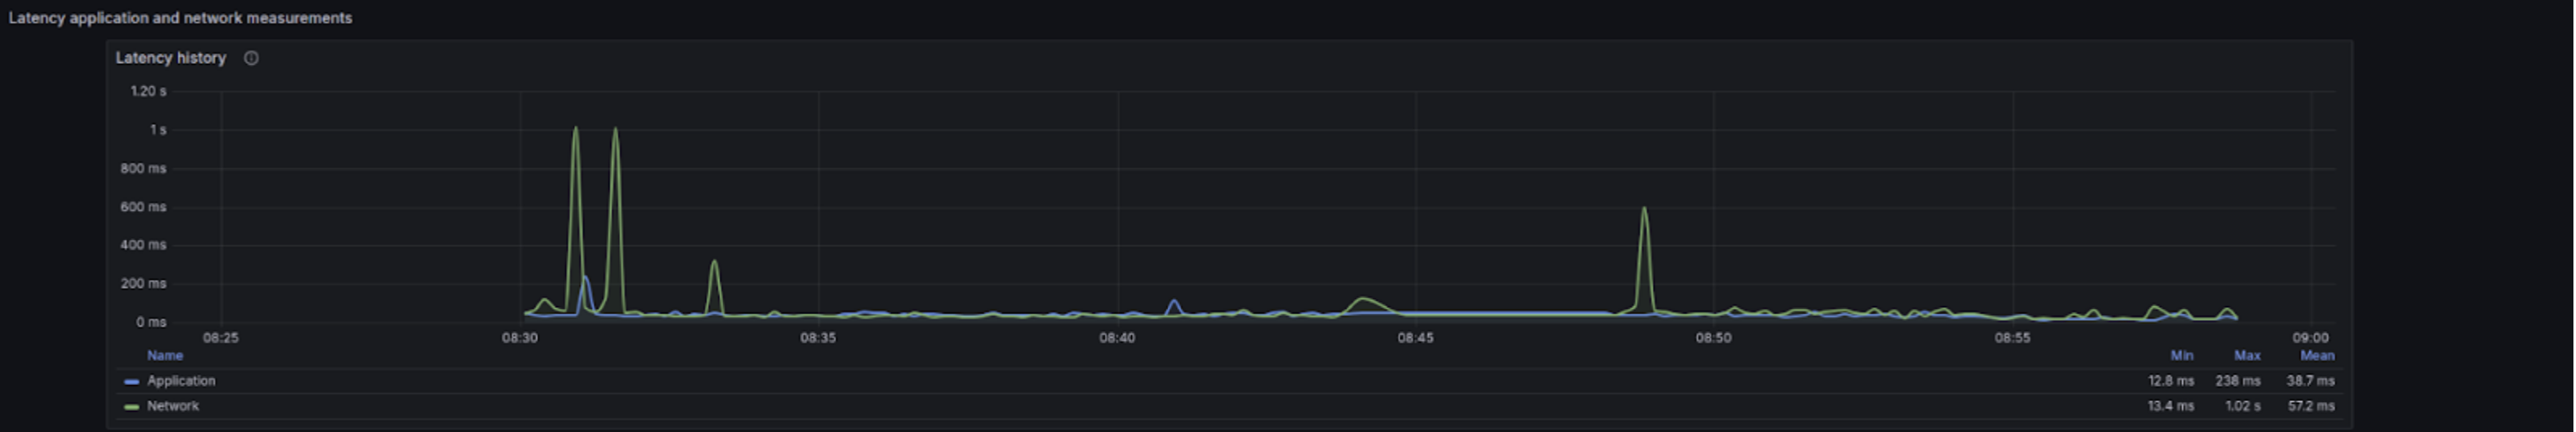
Latency application and network
Contains the timeseries plot of application (HTTP, HTTPS, TCP, and UDP) and network (ICMP and TWAMP) latency.
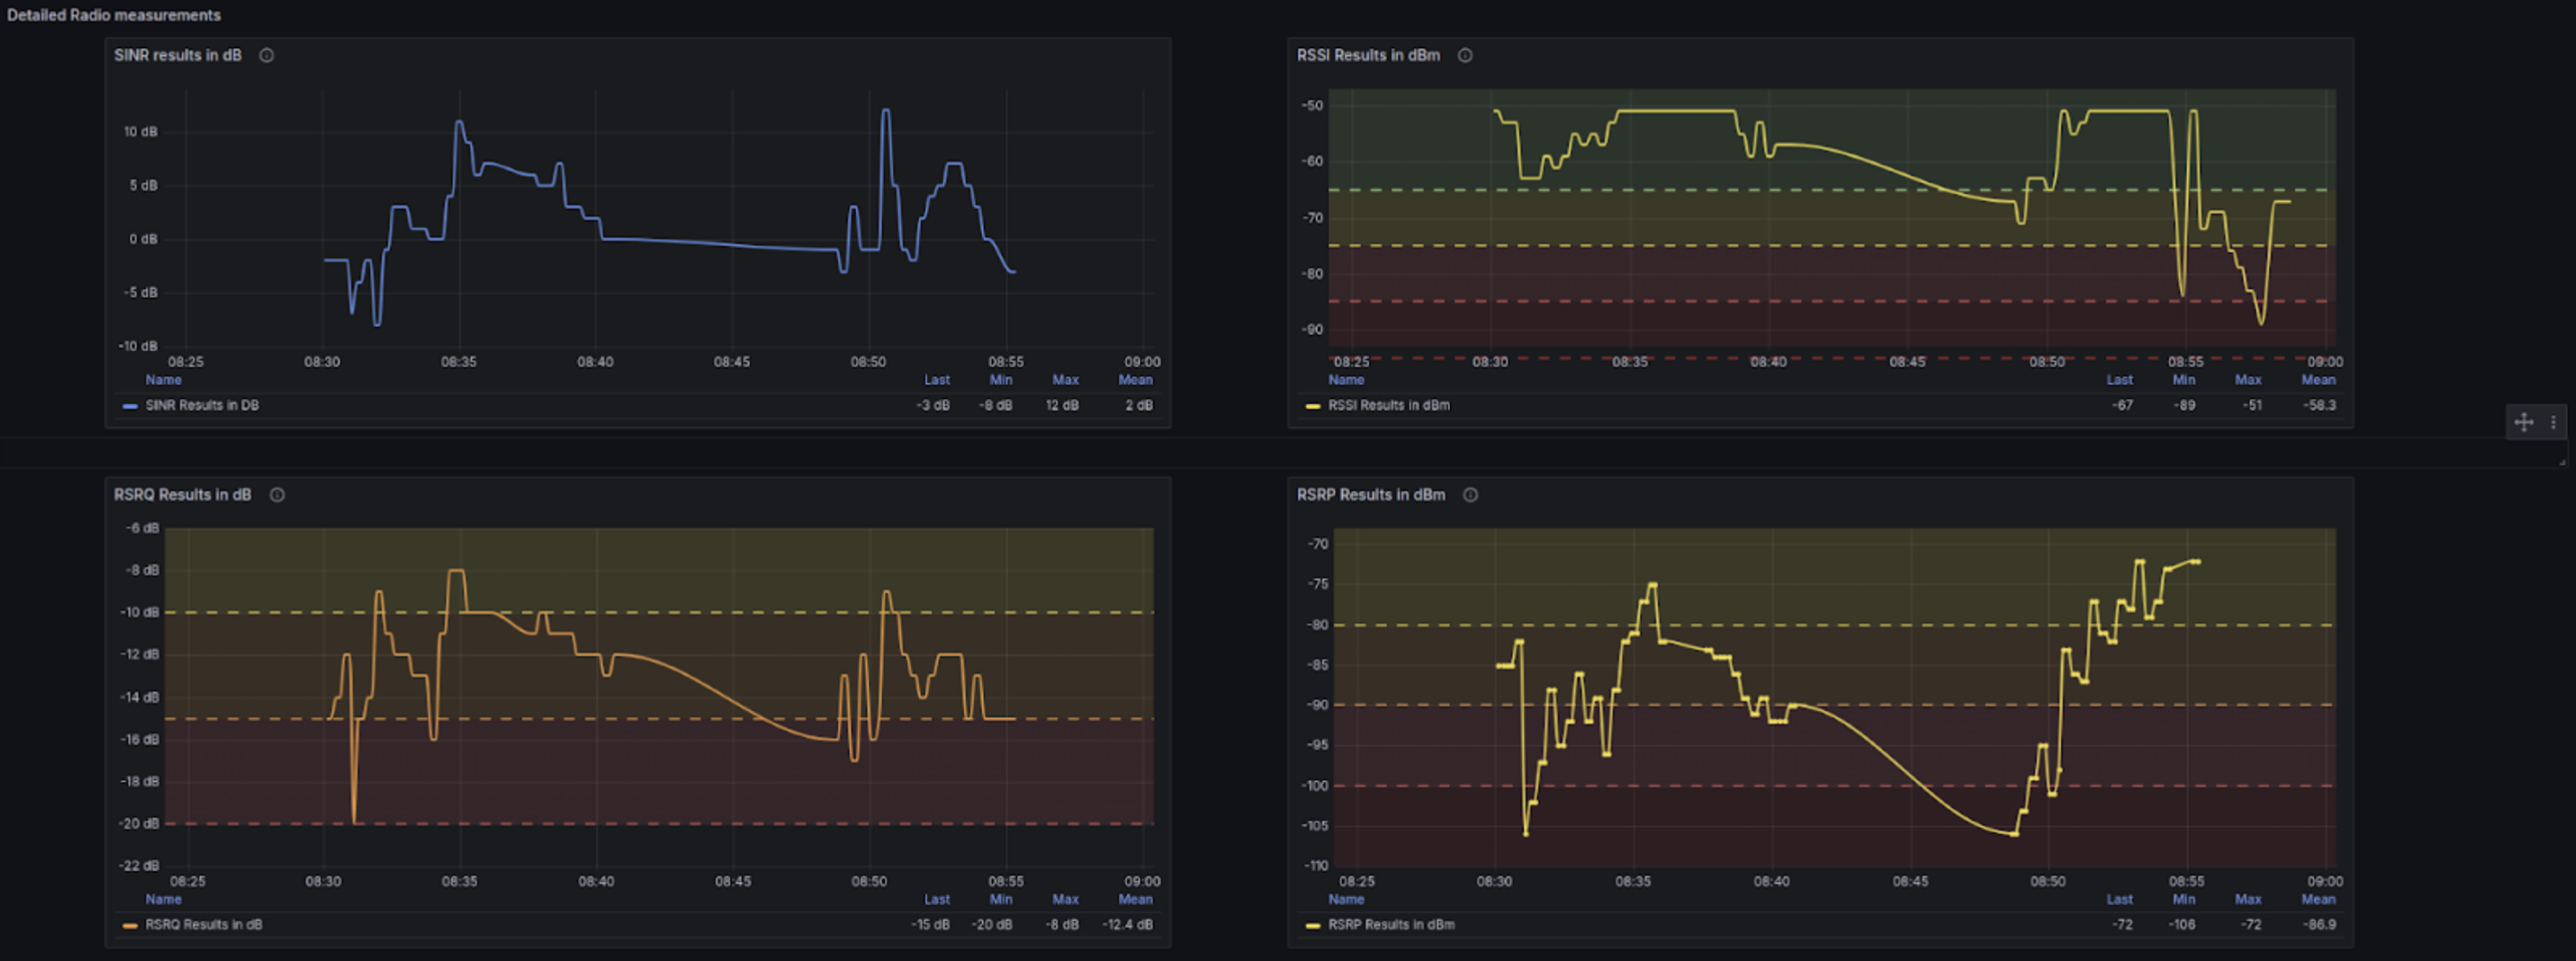
Detailed radio measurements
Timeseries plots of all radio indicators - RSRP, RSRQ, RSSI and SINR.
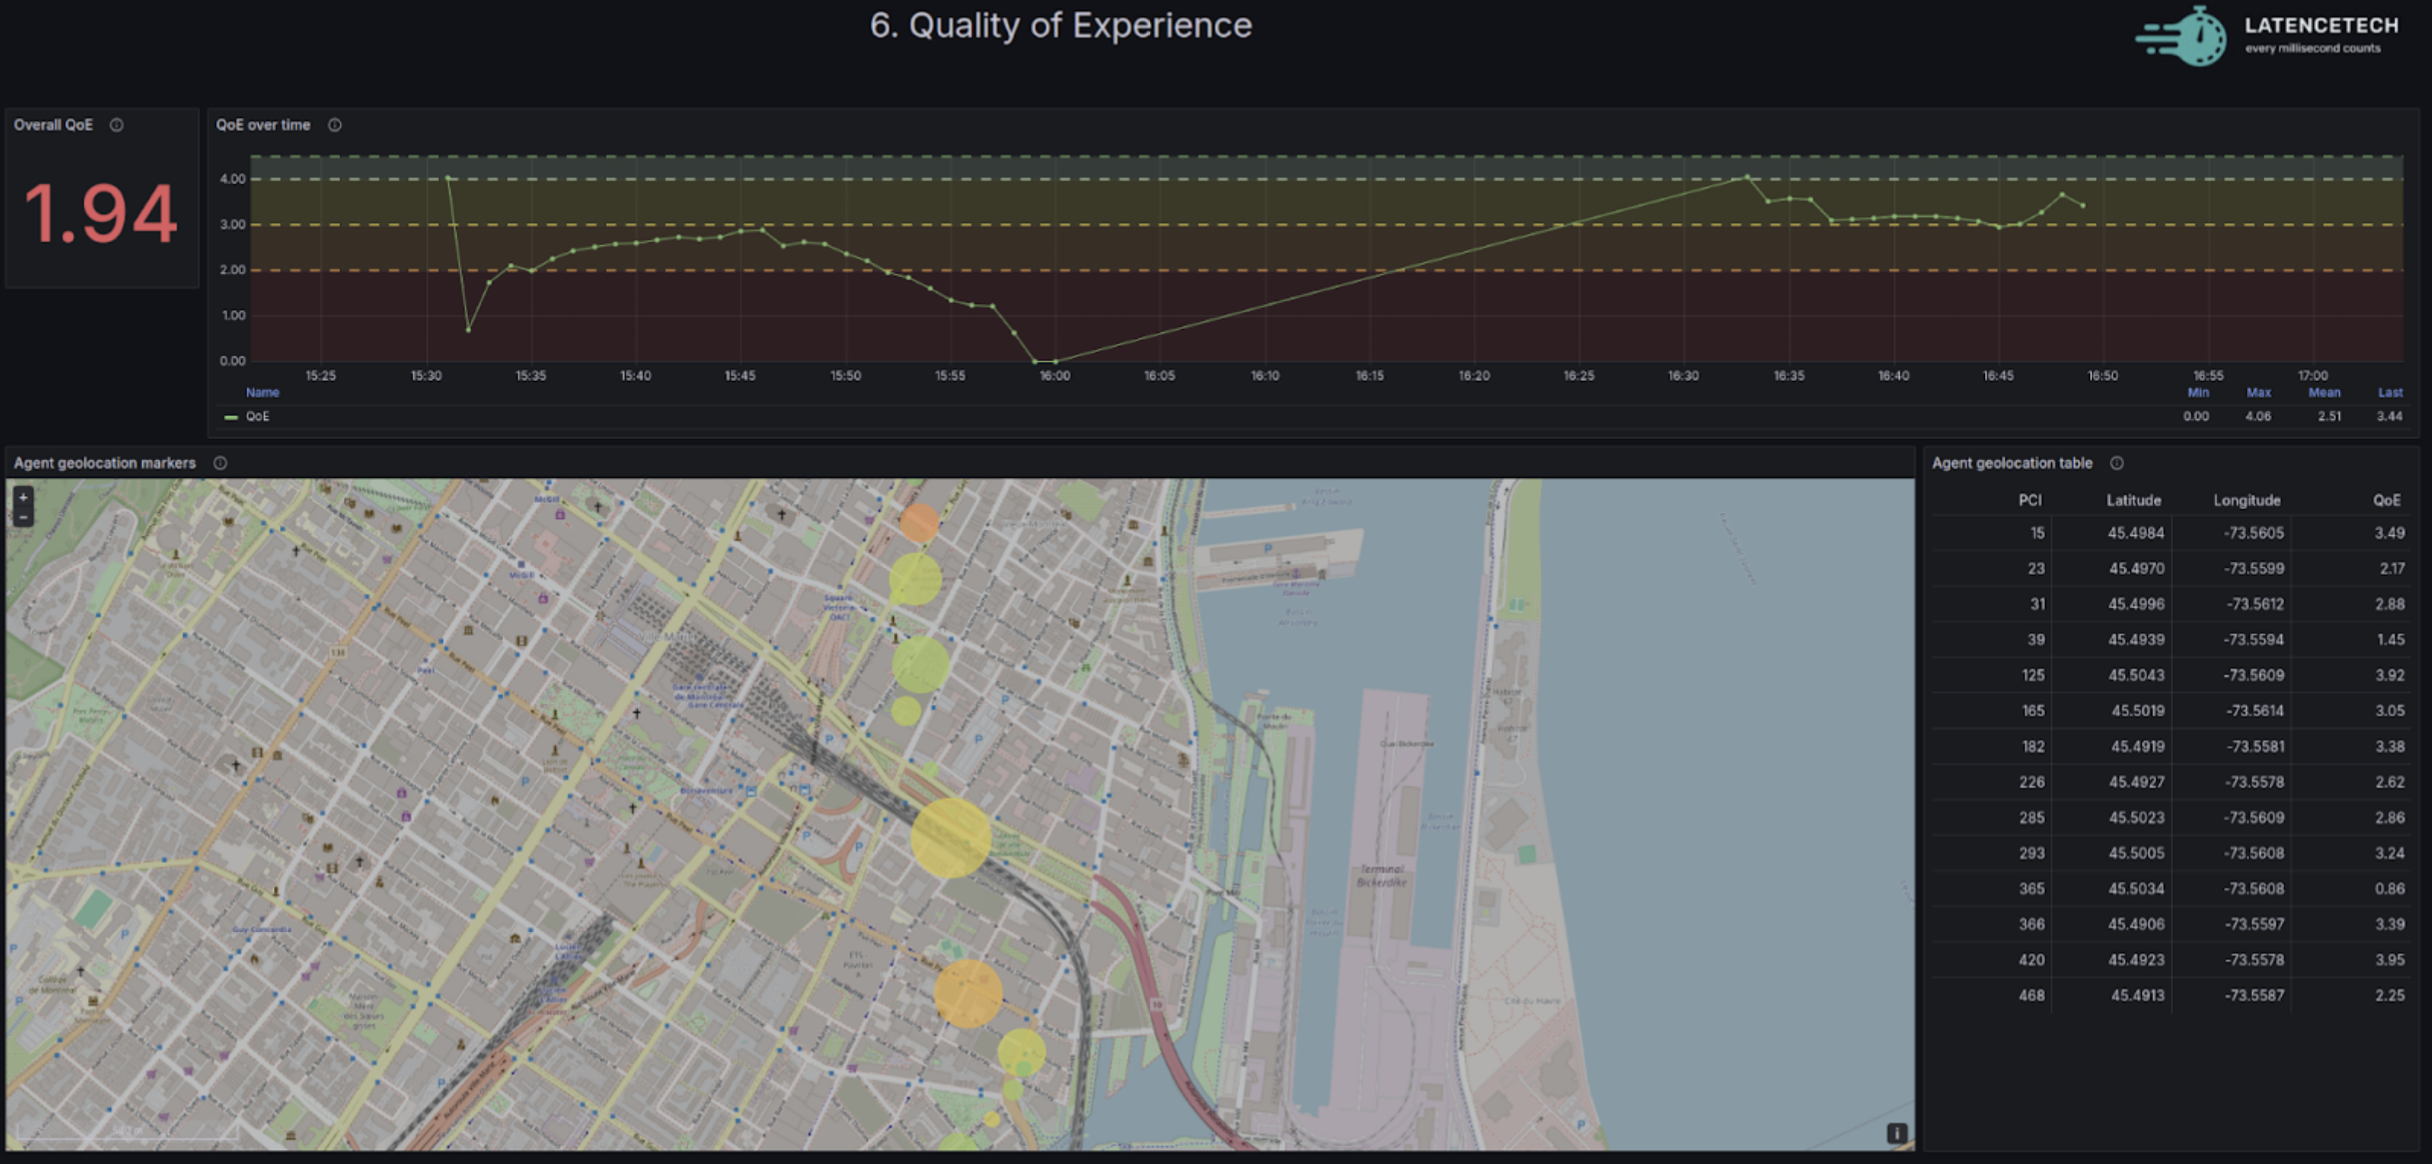
QoE Dashboard
QoE is an indicator with value from 0-5 indicating the quality of the network calculated using latency, jitter and packet loss. The latency, jitter and packet loss values are normalized by dividing by a maximum value for unacceptable performance and then multiplied by the weights and subtracted from 5.
QoE is computed as:
QoE = 5 - (W_L · L_norm) - (W_J · J_norm) - (W_P · P_norm)
where W_L = 1.6, W_J = 1.0, and W_P = 1.6 are the weights for latency, jitter, and packet loss.
Panels
- Overall QoE - QoE calculated over the entire time range.
- QoE over time - QoE calculated over 10-minute intervals every 1 minute.
- QoE geomap by PCI - QoE heatmap with bubble representing each PCI with centroids as average coordinates for the PCI and size depicting the number of measurements for the PCI. The color goes from red-yellow-green based on bad to good QoE value (0-5).
- QoE by PCI - Table with row for each PCI with average coordinates for the PCI and the QoE value
- Video conferencing QoE - This panel uses a different method compared to other panels to estimate the QoE (Quality of Experience) for video conferencing based on real-time network conditions. QoE is computed$
QoS = a⋅e^(b⋅DL) + c/(LR+d) + p⋅ln(TH) + q
QoE = α⋅e^(-β⋅QoS) + γ
Where the parameters (α,β,γ,a,b,c,d,p,q) define the sensitivity of perceived quality to network impairments. The panel visualizes how variations in latency, packet loss, and bandwidth impact the predicted user experience on a 1–5 scale.
Historical Events Insights Dashboard (BETA)
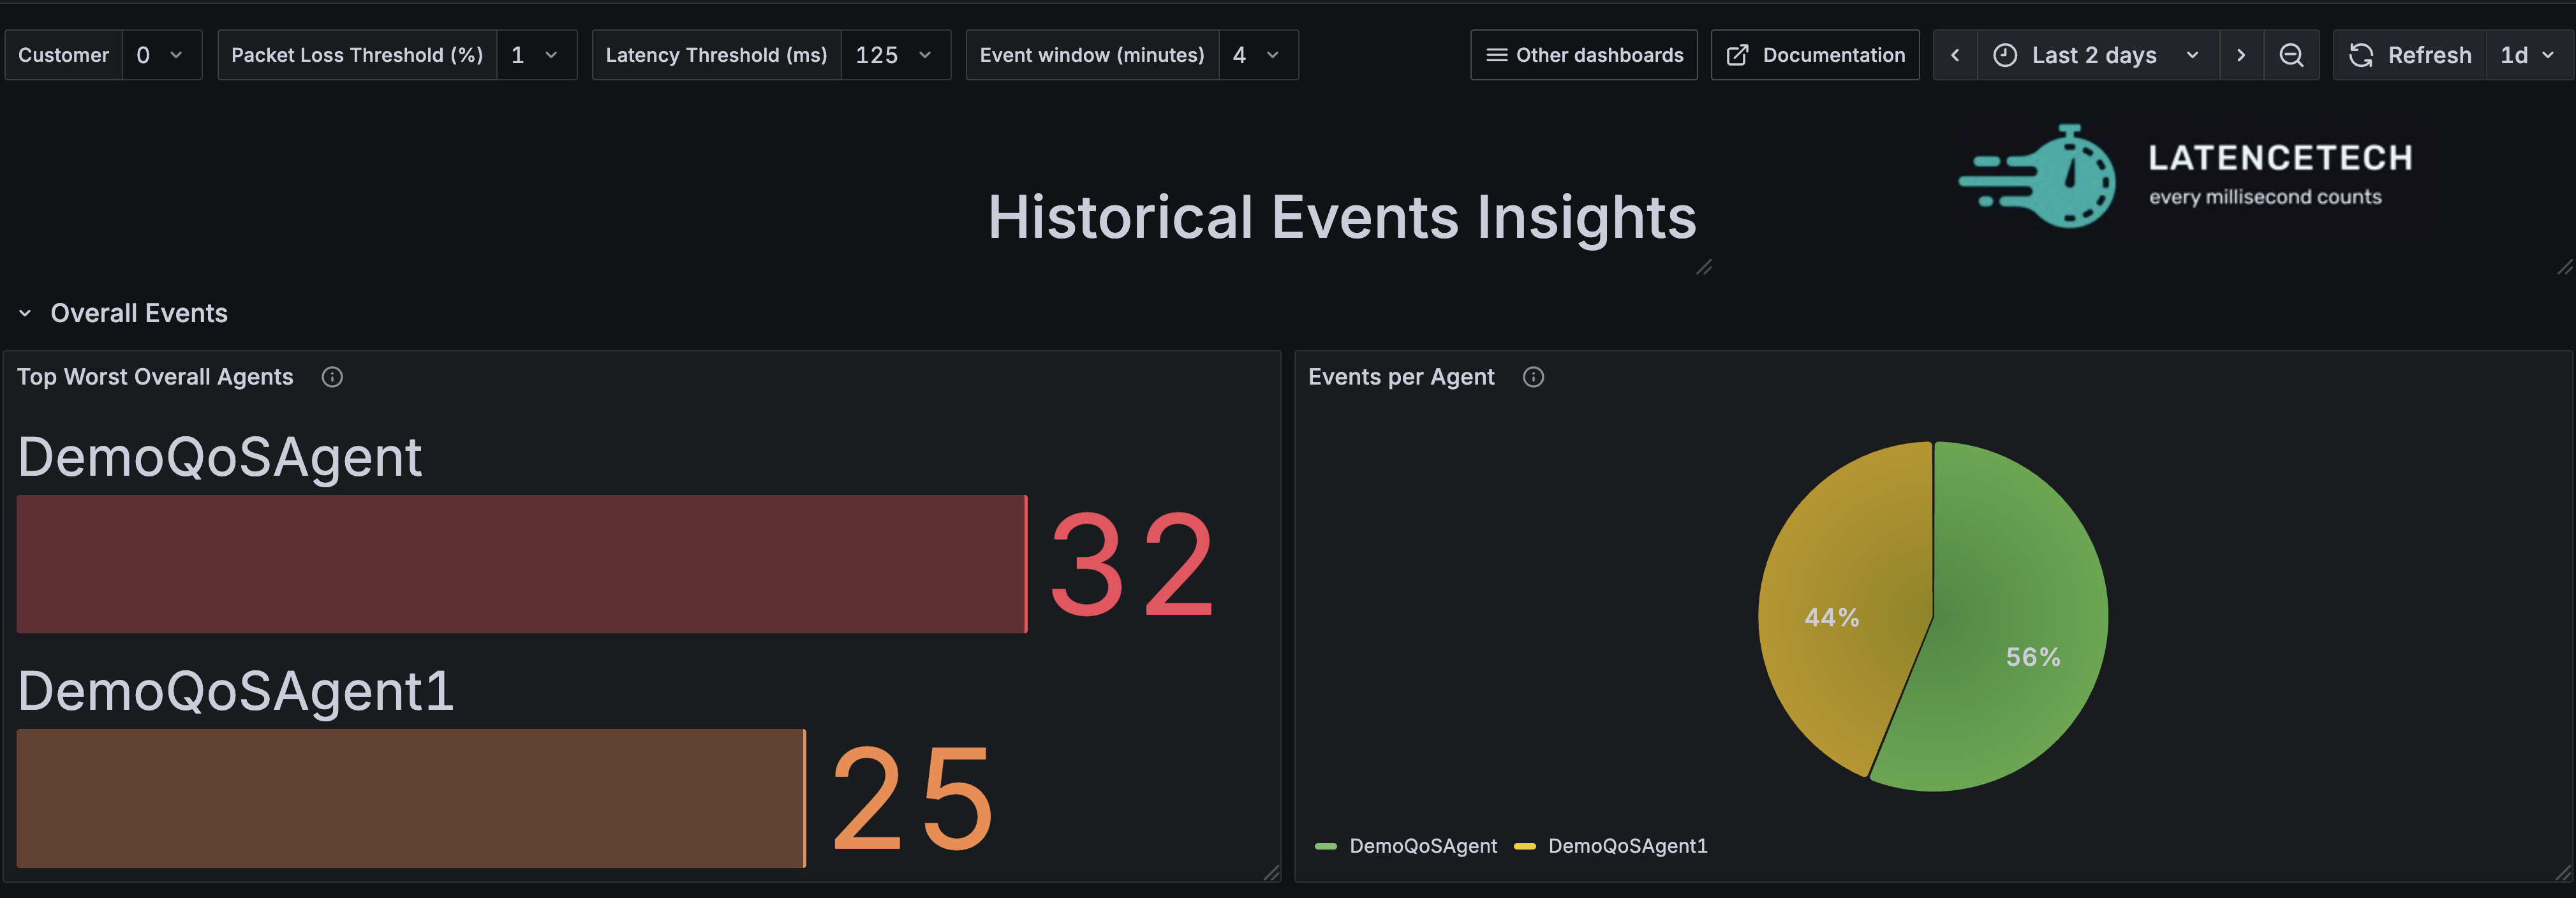
This dashboard highlights the worst-performing agents that exceed the accepted thresholds for Packet Loss and/or Latency within a selected event window.
The Event window (minutes) represents the time period over which the average packet loss or latency is calculated. An event is triggered when this average exceeds the selected threshold for either metric.
Overall Events Section
This section provides an overview of agents based on total events caused by them (packet loss or latency). It includes the following panels:
-
Top Worst Overall Agents:
Displays a bar gauge (maximum 10 agents) showing the agents with the highest number of events, where the average packet loss or latency exceeded their respective thresholds within the selected event window. Agents are ordered in decreasing order of event count. -
Events per Agent:
Displays a pie chart of agents with at least one event, showing each agent's share of the total number of events (packet loss or latency).
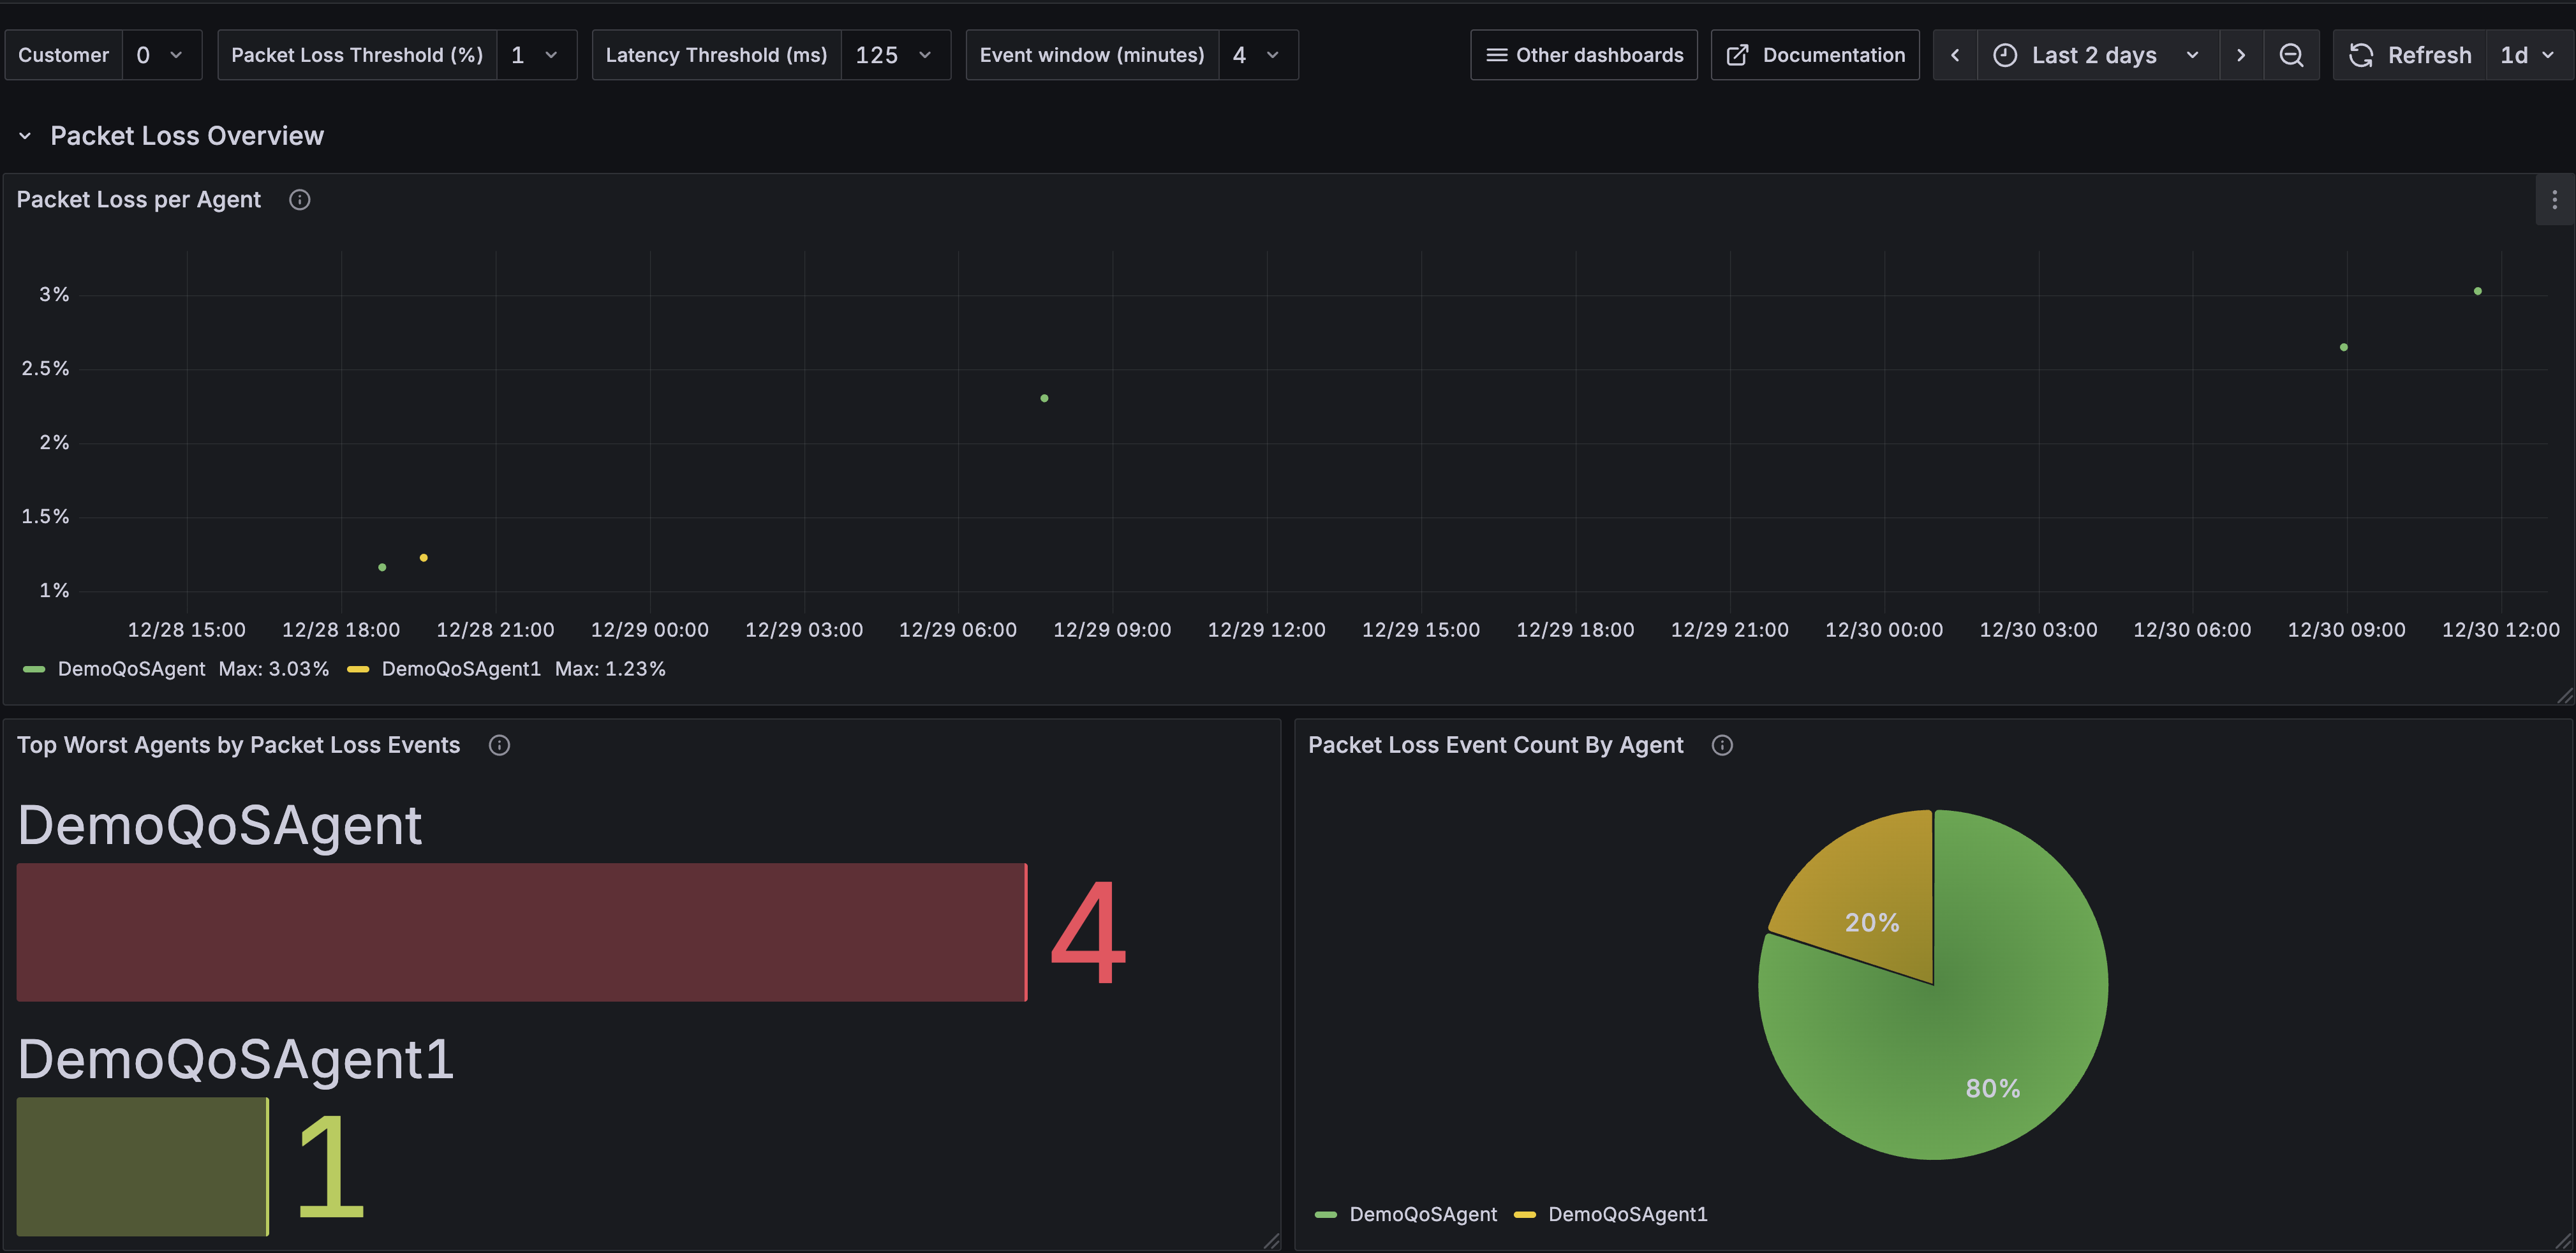
Packet Loss Overview Section
This section focuses specifically on packet loss events caused by agents. It includes the following panels:
-
Packet Loss per Agent:
Displays a time-series graph illustrating packet loss events over time for a selected agent. -
Top Worst Agents by Packet Loss Events:
Displays a bar gauge (maximum 10 agents) showing the agents with the highest number of packet loss events, where the average packet loss exceeded the selected threshold within the event window. -
Packet Loss Event Count by Agent:
Displays a pie chart of agents with at least one packet loss event, showing each agent's proportion of total packet loss events.
Note: For Packet Loss Threshold(%), user can provide custom value.
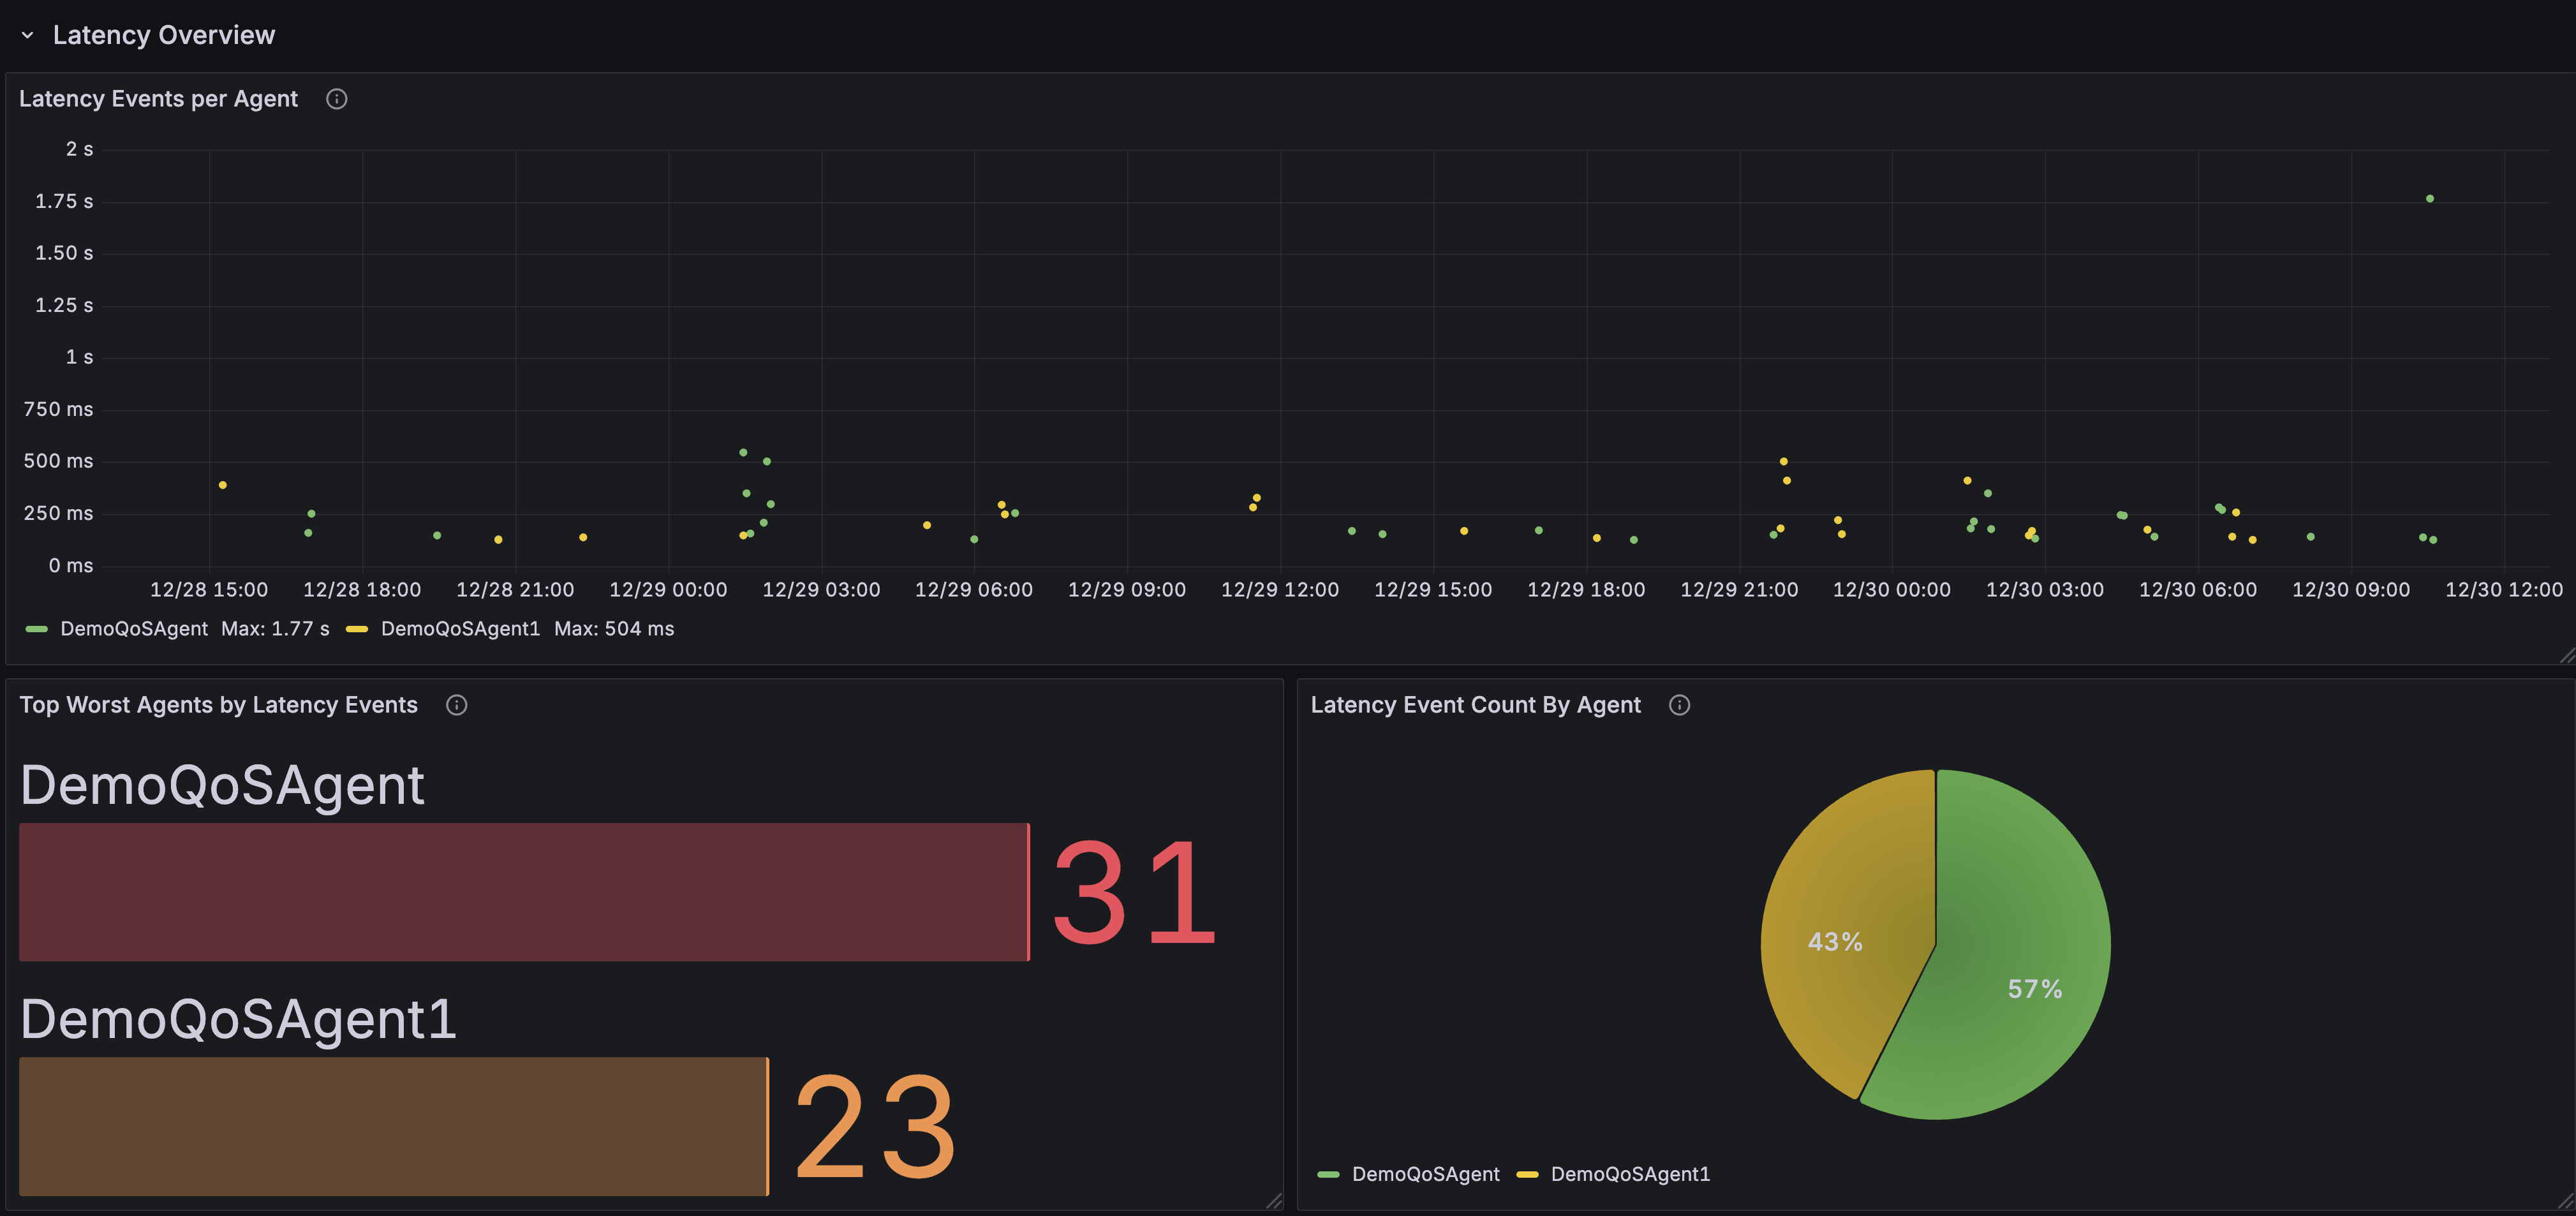
Latency Overview Section
This section focuses on high-latency events caused by agents. It includes the following panels:
-
Latency per Agent:
Displays a time-series graph illustrating high-latency events over time for a selected agent. -
Top Worst Agents by Latency Events:
Displays a bar gauge (maximum 10 agents) showing the agents with the highest number of latency events, where the average latency exceeded the selected threshold within the event window. -
Latency Event Count by Agent:
Displays a pie chart of agents with at least one high-latency event, showing each agent's proportion of total high-latency events.
Historical KPI Insights
The historical KPI dashboard displays values of various KPIs aggregated over a 2 minute interval with ability to select multiple agents and compare them.
Analyzer Monitoring
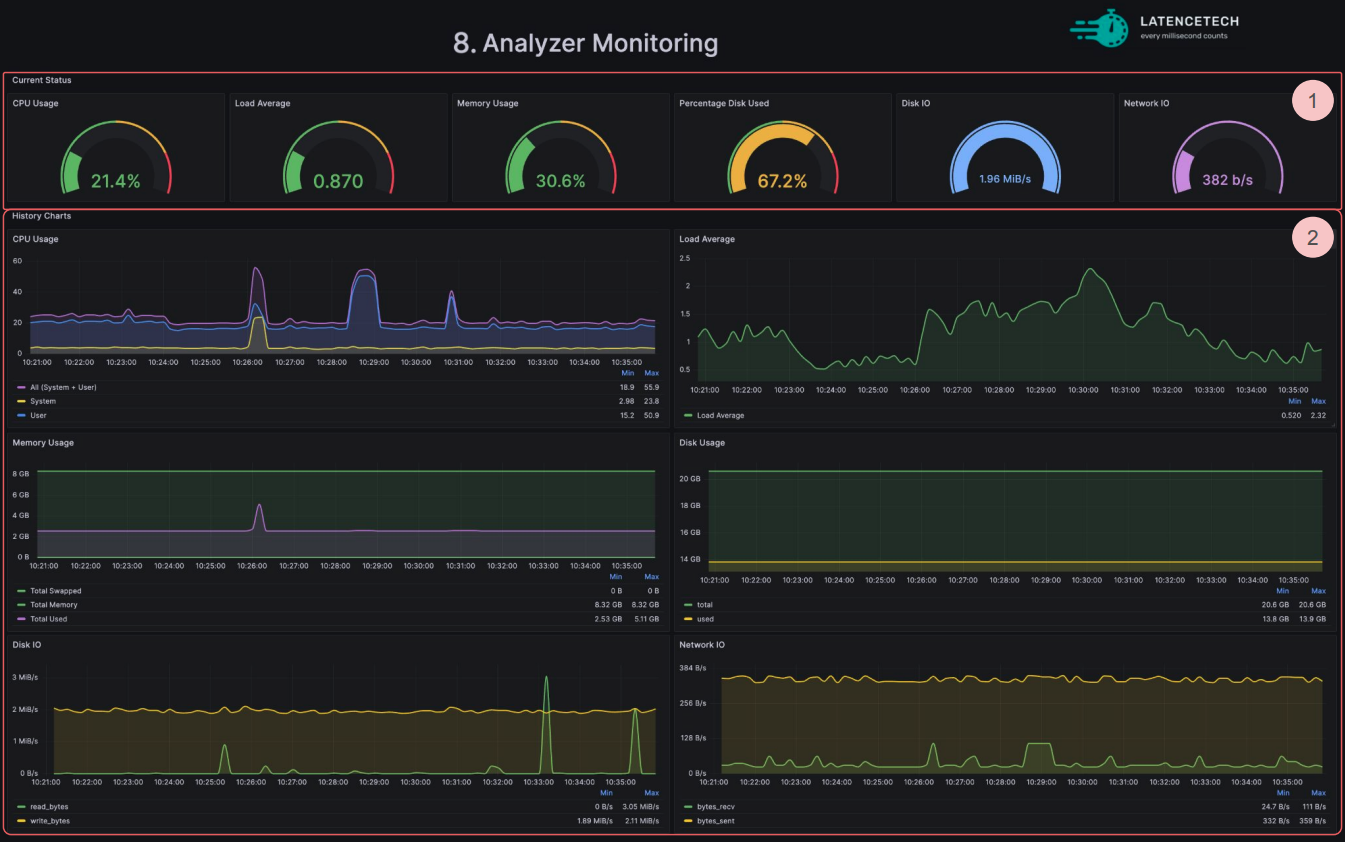
The analyzer monitoring dashboard displays various metrics about current status of the analyzer's host:
- The current status of the analyzer (1) with from left to right the CPU usage, the load average, the memory usage, the percentage disk used, the disk IO and the network IO.
- The detailed history charts for each indicators (2).
Customized Dashboard
If you need a customized dashboard, please contact us at contact@latencetech.com