QoS Agent Management Dashboard
A web-based management dashboard for QoS Agents that provides an intuitive interface for monitoring, configuring, and managing your QoS Agent.
Overview
The QoS Agent Management Dashboard allows you to:
- Monitor and manage Docker containers running QoS agents
- View real-time container logs and system status
- Edit and validate agent configurations through a web interface
- Access network information and connectivity status
- Perform system overview and health checks
The QoS Agent Management Dashboard needs to be installed on the VM running the agents
Quick Start
Installation
We provide an automated installation script that handles all dependencies and setup:
1) Download the installation script here:
wget https://api.latence.ca/software/agent-mgmt-install.sh
2) Run the script
sudo bash agent-mgmt-install.sh
The installation script will:
- Install required system dependencies (Python, etc.)
- Download and set up the management system
- Configure and start the web interface and backend services
- Set up systemd services for automatic startup
Accessing the Dashboard
Once installed, access the web dashboard at:
http://your-server-ip:12022
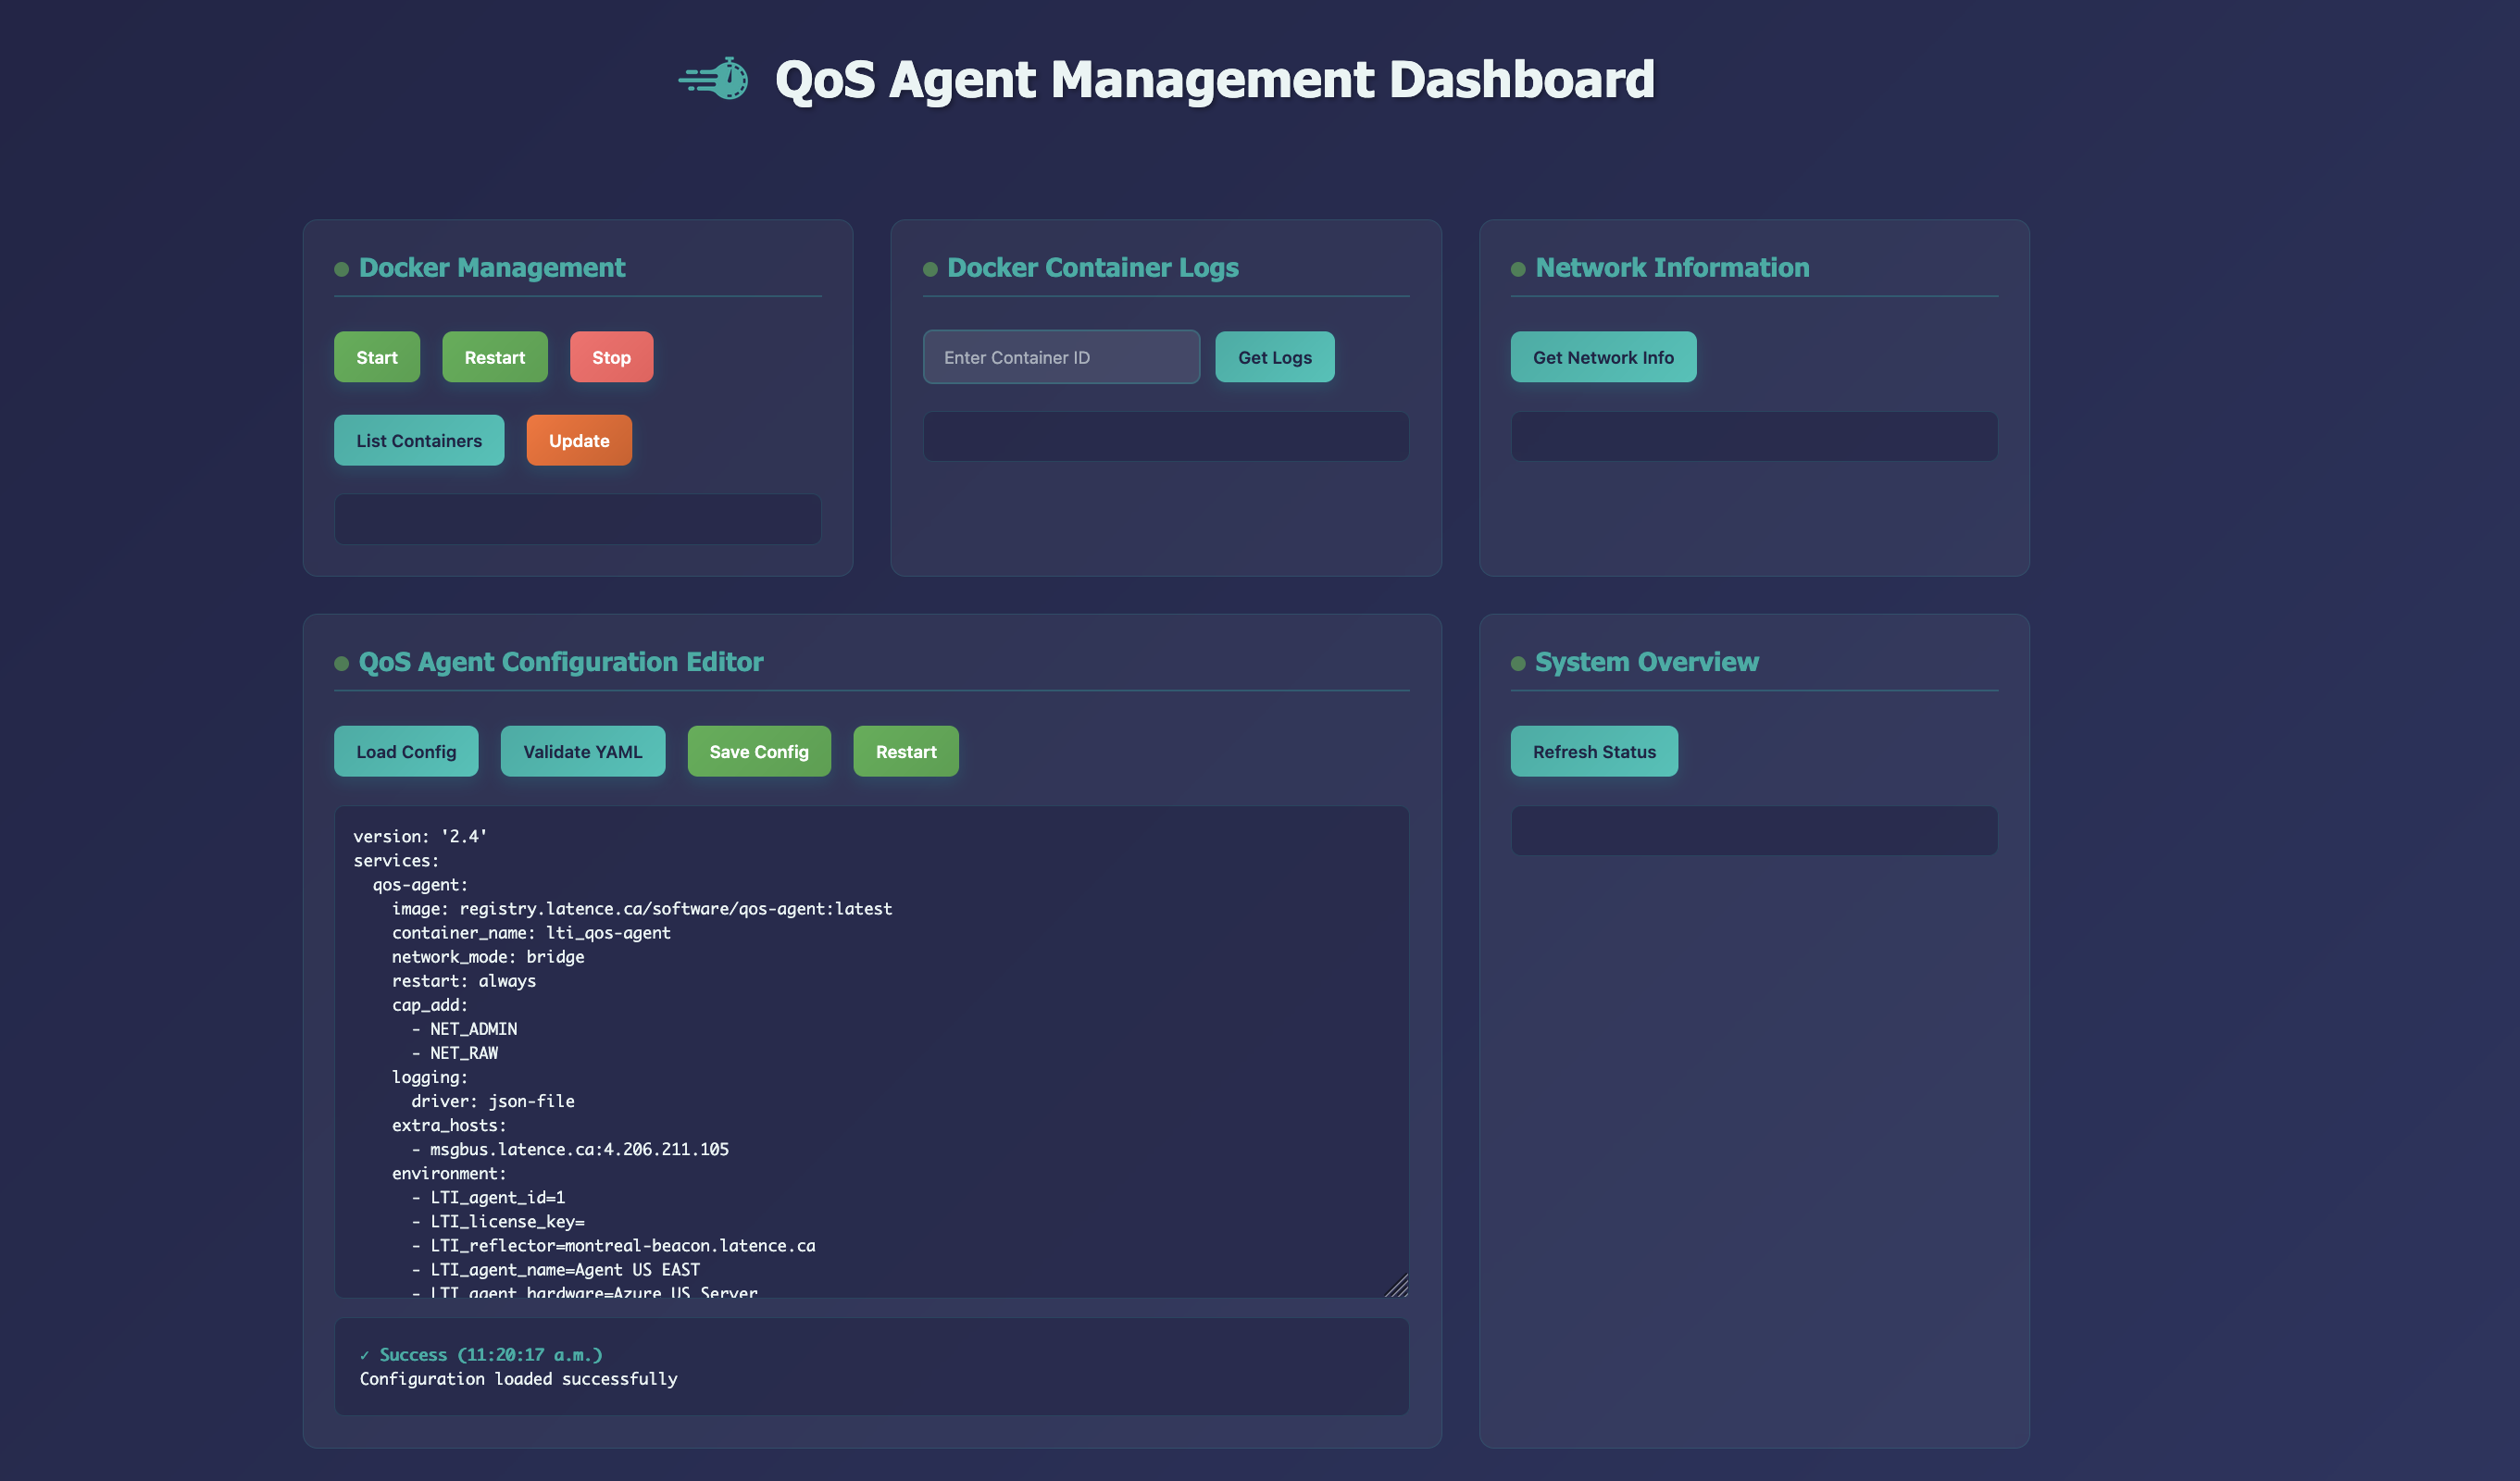
Dashboard Features
Docker Management
- Start/Stop/Restart: Control your QoS agent containers
- Update: Pull latest container images and restart services
- List Containers: View all running and stopped containers
Container Logs
- View real-time logs from any container
- Search and filter log entries
- Monitor agent performance and troubleshoot issues
Network Information
- Display system network configuration
- View network interfaces and connectivity status
- Monitor network health
Agent Configuration Editor
- Edit QoS agent configurations through a web interface
- YAML Validation: Real-time syntax and structure validation
- Connectivity Testing: Automatic validation of reflector and msgbus connectivity
- Configuration Backup: Save and restore configuration versions
System Overview
- Real-time system status monitoring
- Resource usage information
- Service health checks
Configuration Management
Agent Configuration File
The system manages your lti_qos-agent.yml configuration file, which defines:
- QoS agent Docker container settings
- Network configuration and capabilities
- Environment variables (agent ID, license key, reflectors)
- Logging and restart policies
Validation Features
The built-in validator checks:
- YAML syntax and structure
- Required Docker Compose fields
- Network connectivity to reflectors and message bus
- Agent ID uniqueness
- GPS coordinates and IP address formats
- Environment variable completeness
Common Operations
Starting Your QoS Agent
- Access the dashboard at
http://your-server-ip:12022 - Navigate to Docker Management
- Click Start to launch your QoS agent containers
- Monitor startup in Container Logs
Updating Agent Configuration
- Go to QoS Agent Configuration Editor
- Click Load Config to view current settings
- Make your changes in the editor
- Click Validate YAML to check for errors
- Click Save Config to apply changes
- Restart containers to apply new configuration
Viewing Logs
- Navigate to Container Logs
- Enter your container ID or use List Containers to find it
- Click Get Logs to view recent activity
- Monitor for errors or performance issues
System Monitoring
- Check System Overview for general health
- Use Network Information to verify connectivity
- Monitor Container Logs for ongoing operations
Troubleshooting
Common Issues
Start, Stop, Restart and Update commands not working:
- The scripts use docker version 2
- They therefore use
docker composeand notdocker-compose - Should you be using
docker-compose, you can go into thescripts/directory and change the scripts to use your version
Dashboard not accessible:
- Ensure port 12022 is open in your firewall
- Check that services are running with
systemctl status
Configuration validation errors:
- Verify YAML syntax is correct
- Ensure all required fields are present
- Check network connectivity to reflectors
Container start failures:
- Review container logs for error messages
- Verify Docker is running:
sudo systemctl status docker - Check configuration file permissions
Service Status
Check if services are running:
sudo systemctl status grpc-server.service
sudo systemctl status grpc-ui.service
View Service Logs
sudo journalctl -u grpc-server.service -f
sudo journalctl -u grpc-ui.service -f
Restart Services
sudo systemctl restart grpc-server.service
sudo systemctl restart grpc-ui.service
Uninstallation
We also provide an uninstallation script that deletes all the services created and agent management directory:
1) Download the uninstallation script here:
wget https://api.latence.ca/software/agent-mgmt-uninstall.sh
2) Run the script
sudo bash agent-mgmt-uninstall.sh
This will delete:
- gRPC server and Web UI services
- Project directory
- grpcurl from /usr/local/bin/
- All related systemd services
Security Notes
- The dashboard runs on port 12022 by default
- Ensure proper firewall configuration for your environment
- Regular configuration backups are recommended
- Monitor system logs for any unusual activity