Elina Testing Tools
Elina Traffic Shaper
Introduction
LatenceTech Traffic Shaper 1.11 can be used to disturb or “shape” the traffic of an IP network i.e. modify the connectivity characteristics of the host network interface by introducing latency, instability through packet duplicate or loss, reducing available bandwidth or throughput. The tool shall be used in conjonction with the LatenceTech’s QoS-Agent and LatenceTech’s Analyzer platform for real-time monitoring, prediction and optimization.
How to use
LatenceTech Traffic Shaper shall be installed and configured on the same host where the QoS-Agent is running. Changing connectivity parameters on the tool will automatically add limits and constraints to the network interface of the host on which the tool is installed.
Setup
You will need to have the port 81 opened on your machine.
You can install the trafficshaper using this command on your agent:
sudo docker run -d -p 81:80 --privileged --pid=host registry.latence.ca/internal/trafficshaper
Or use this yaml file:
wget https://api.latence.ca/internal/trafficshaper.yaml
And launch with this command :
docker-compose -f trafficshaper.yaml up -d
Once launched, you can access it at: http://machine_ip:81/netem
User interface
For each connectivity parameter, use the + or - buttons to increase or reduce the value, “R” to reset to the default value or “max” to set it to its maximum. Adjusting the value of a parameter will ADD this value to the existing host default level.
For example, if your host experiences an average latency of 25 milliseconds (ms) measured with ICMP, adding +20ms to the “added latency” parameter will push the new latency level to about 45ms. The approach is similar for Jitter. For the Throughput parameter, the default is “unlimited”. It can be reduced using the “-” by selected steps in of about 50 Mbit/s.
Changing the Packet Duplicate or Packet Loss parameters, as a percentage, will add connectivity instability. Once you adjust the parameters, you can use the Timer located at the bottom to set a specific time to run these parameters e.g. 30 or 60 seconds. The Countdown panel will show the residual time of use for the adjusted parameters. At the end of the timed period, all parameters are reset to their default value.
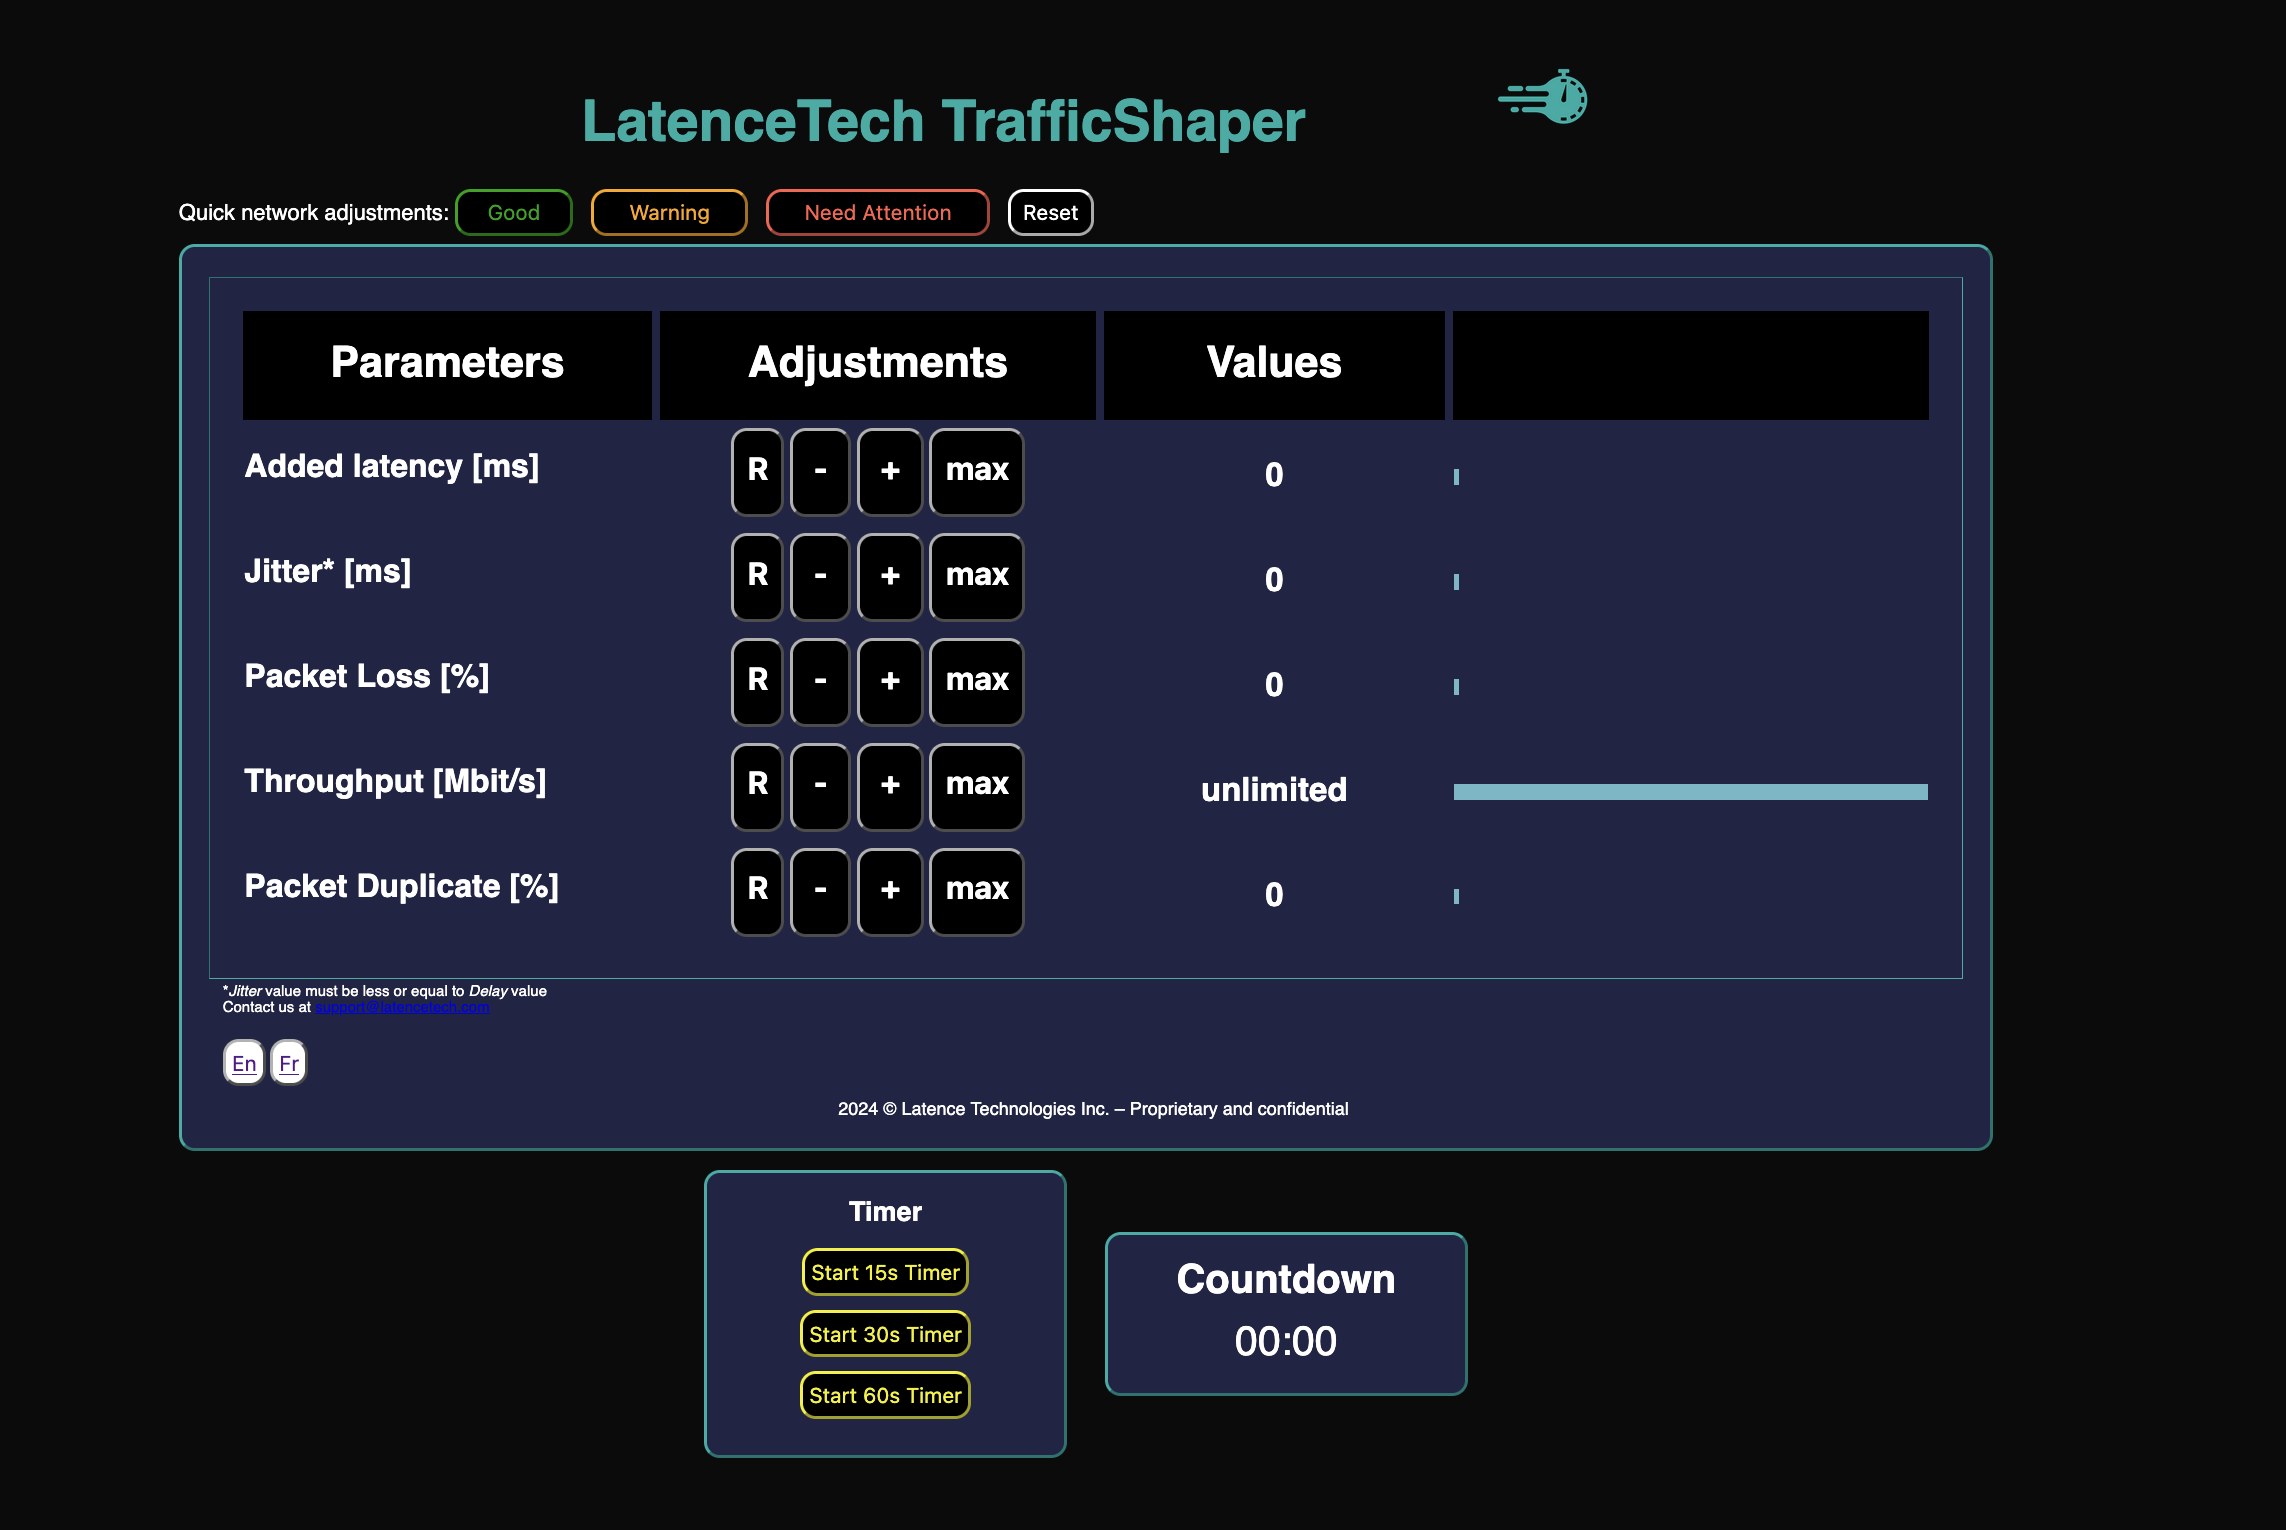
Quick Network Adjustments
Use the Quick Network Adjustments top buttons, to set parameters for a typical set of parameters values reflecting a “good” (in green) or below average / “warning” (in yellow) or bad/instable network “need attention” (in red). You can reload the tool by pressing the “reload” button. You can reset a parameter value by pressing the “R” button.
Visualisation of results in LatenceTech Dashboards
Changing parameter value in TrafficShaper will impact the measured quality and latency of the connectivity. The QoS-Agent produced results will be displayed on the Analyzer real-time dashboards within a few seconds (depending on the network connectivity performance).
Disclosure
LatenceTech would like to thanks Orange Group for the initial idea and early implementation of this tool.
No claims, representations or warranties, whether express or implied, are made by our company as to the safety, reliability, durability and performance of this tool. Usage of this tool is primary for testing purposes. Remember to reset the parameter values following each tests to enable the default connectivity level of your host. Refer to www.latencetech.com/eula for the End User License Agreement
Elina Traffic Controller (Elina-TC)
Introduction
Elina Traffic Controller (Elina-TC) v1.3.x is a powerful command-line network emulator used to disturb, impair or "shape" the inbound and outbound traffic of an IP network. It modifies the connectivity characteristics of a host's network interface by introducing precise, repeatable impairments like latency, jitter, packet loss, and rate limits. This version includes automatic stripping of percentage symbols from profile values for tc compatibility and enhanced pre-application validation for profile parameters. The tool is designed to be used by itself or in conjunction with LatenceTech's QoS-Agent and Analyzer platform for real-time monitoring of the impact of these impairments on your application's performance.
How it works
Elina-TC shall be installed and configured on the host machine whose network is to be tested (often where the QoSAgent is also running). Elina-TC uses the underlying Linux utilities tc, netem and ifb to create a symmetric shaping environment. This means that any applied profile will affect both upload (egress) and download (ingress) traffic, providing a complete and realistic simulation.
Setup
Elina-TC is a Python script and requires Python 3.7+ and the iproute2 package to be installed on your Linux agent.
- Download the tool:
wget https://api.latence.ca/software/elina-tc.zip
-
Unzip and move into the directory
-
Make the script executable (Recommended): This is a one-time setup step that makes the script easier to run.
chmod +x elina-tc.py
Modes of Operation (User Interface)
Elina-TC is a flexible command-line tool that can be run in several modes. All commands that apply rules must be run with sudo.
- Validation Mode (Safe First Step)
Before applying any rules, you can validate your profile files for logical errors. This mode does not require
sudo.
./elina-tc.py --validate -f profiles/satellite/profiles_GEO_HTS.json
- On-the-Fly Mode (Quick Tests)
For applying simple impairments without needing a profile file. The impairment is applied for a default of 30 seconds, which can be changed with the
-dflag.
# Apply 100ms of delay and 2% loss to interface eth0 for 60 seconds
sudo ./elina-tc.py -i eth0 -d 60 --onthefly "delay 100ms loss 2%"
- Batch Mode (Automation) For running automated test scenarios from the profile library. This mode is ideal for CI/CD integration.
# Run through the entire Flaky Wi-Fi simulation on eth0
sudo ./elina-tc.py -i eth0 -n 1 -f profiles/impairments/profiles_FlakyWIFI_MobileEdge.json
- Interactive Mode (Live Debugging & Direct Commands) For live, manual control of network conditions, or to execute single interactive commands directly from the command line without entering the interactive shell. This is perfect for demonstrations, hands-on debugging, or scripting single actions.
Entering Continuous Interactive Session:
sudo ./elina-tc.py -i eth0 --interactive -f profiles/satellite/profiles_LEO_Starlink.json
Once launched into the continuous session, you can use commands like list, apply <name>, status, and clear.
Executing a Single Interactive Command Directly:
# Apply a profile by name and automatically clear it after 30 seconds
sudo ./elina-tc.py -i eth0 -f profiles/satellite/profiles_LEO_Starlink.json --interactive apply "LEO Starlink Profile (Delay 20ms)" for 30s

# Get the current TC status on the interface and then exit
sudo ./elina-tc.py -i eth0 --interactive status

# Clear all TC rules on the interface and then exit
sudo ./elina-tc.py -i eth0 --interactive clear
- Web User Interface Mode (Beta Version) We have included a beta version of a Web UI for your testing. The purpose of the UI is to faciliate the interaction with elina-tc for users less at ease with the CLI interface. With appropriate previledges and permissions, install the python Flask package and configure the opening of port 5000 (or another) for Flask Server network access then check or adjust your firewall settings (if needed). You can then start the web app using the command below:
python3 app.py &
You should see output indicating the server is running, similar to: * Running on http://0.0.0.0:5000
- Find the Linux Server's IP Address: On the Linux server, run
ip addr showto find its IP address (e.g., 192.168.1.105). - Open Your Browser: On your Mac or PC, open Chrome, Firefox or Safari.
- Navigate to the UI: In the address bar, type the server's IP address followed by
:5000.
http://192.168.1.105:5000
Thanks in advance for sharing your comments and suggestions with us on this Web UI at support@latencetech.com
The Profile Library
Elina-TC comes with a rich library of expertly crafted profiles located in the profiles/ directory. These are organized by category:
* /impairments: Simulates general network degradation patterns like rising latency or packet loss.
* /satellite: Simulates specific satellite links (GEO, MEO, LEO).
* /asymmetric: Simulates links with different upload/download speeds (Fiber, Cable, 5G/4G).
Visualisation of Results in LatenceTech Dashboards
Changing network conditions with Elina-TC will directly impact the measured quality and latency of the connectivity. The results, as measured by the QoS-Agent, will be displayed on the Analyzer's real-time dashboards within a few seconds, allowing you to observe the cause-and-effect relationship between network impairments and your application's performance.
Important Notes
- Sudo Requirement: All modes that modify the network require
sudoprivileges. - Symmetric Shaping: Remember that all rules are applied to both upload and download traffic.
- Enhanced Validation: Profiles are now pre-validated for correct formatting and value ranges. Malformed profiles will prevent
tccommands from being attempted, providing clearer error feedback. - Usage Caution: This tool directly modifies the host's networking. It is highly recommended to use it on dedicated test interfaces to avoid disrupting critical network traffic. The script is designed to automatically clean up all rules on exit.
Additional Information
There are multiple README files in the elina-tc program providing additional technical details on the usage modes and options. A specific file explain our use of TBF parameters. There is also a test plan and several README files providing details on the predefine profiles.
Elina Traffic Generator
Under construction. Details to come soon.