Elina Traffic Generator (Elina-TG)
Introduction
Elina Traffic Generator (elina-tg) is a powerful, command-line traffic generation tool used to simulate a wide variety of application and network behaviors. It can generate multiple, concurrent streams of TCP, UDP, and RTP traffic with highly configurable parameters, including packet size, variable rates, IPv4/IPv6, QoS markings (DSCP), and sophisticated, customizable payloads.
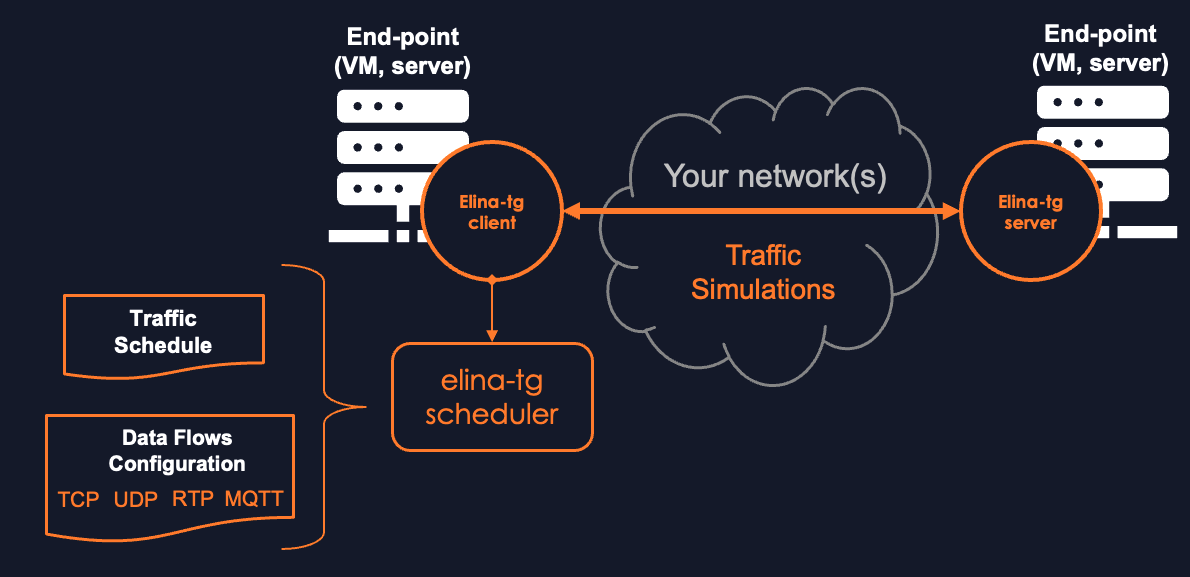
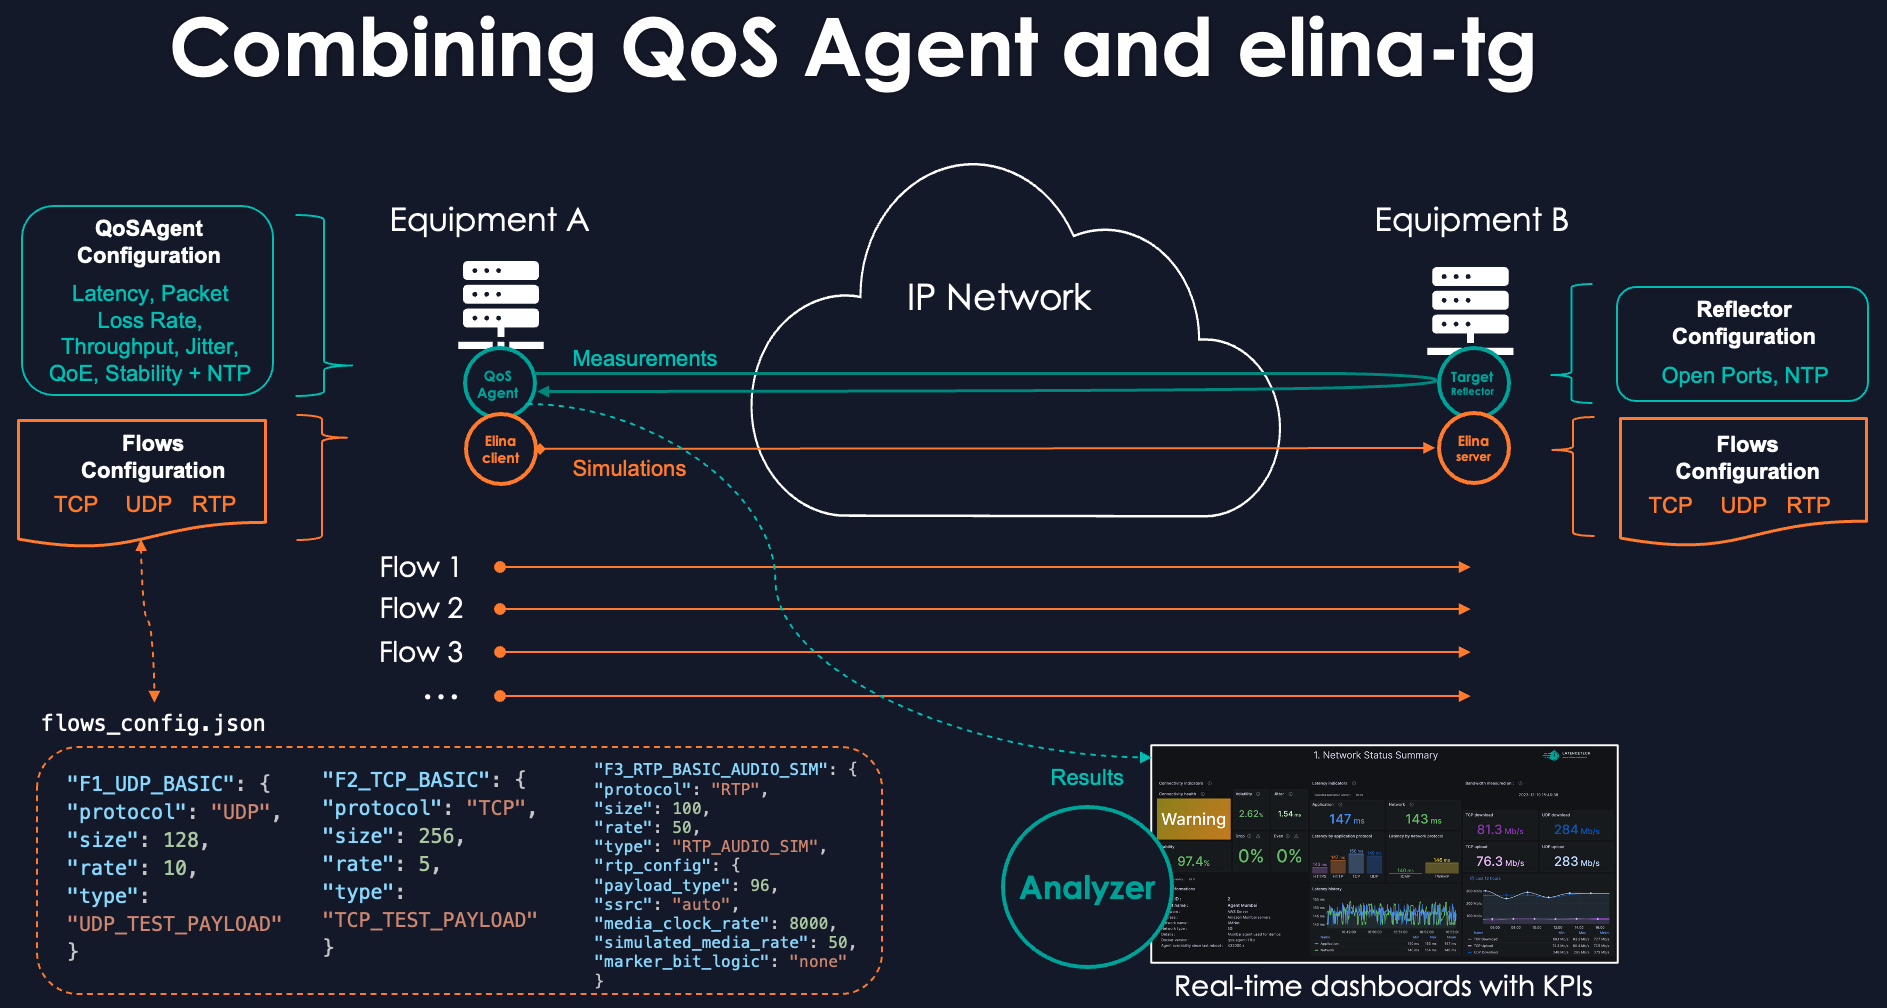
Elina-TG can be used as a standalone tool for network testing and QoS validation or integrated with LatenceTech's QoS-Agent and Analyzer platform. This allows you to generate realistic application traffic while simultaneously measuring its performance and quality in real-time.
How it works
Elina-TG operates in a client/server model. A "client" instance reads a flow configuration file and sends traffic, while a "server" instance listens for that traffic, measures key metrics like packet loss and jitter, and logs the results. The tool can run in client, server, or both modes (for simple loopback tests on a single machine). It also includes a powerful schedule mode to orchestrate complex, time-based test sequences.
Setup (v2.7.5 and later)
Elina-TG is a Python application and requires Python 3.7+.
1. Prerequisites:
Ensure you have the necessary system packages installed. On Debian/Ubuntu, this can be done with:
sudo apt-get update && sudo apt-get install -y python3-pip python3-venv iproute2
2. Download and Unpack the tool:
wget https://api.latence.ca/software/elina-tg.zip
unzip elina-tg.zip
cd elina-tg-release
3. Set up a Virtual Environment (Recommended):
# Create and activate a virtual environment
python3 -m venv venv
source venv/bin/activate
Modes of Operation (Command Line Interface)
Once installed, Elina-TG is run using the elina-tg command.
1. A Simple Loopback Test (First Steps) This is the best way to verify your installation. It runs both a client and a server on your local machine for 15 seconds.
# Run the test in verbose mode and save results
elina-tg both --duration 15 -v --stats_file my_first_test_results.json
After the run, a human-readable summary is printed to the console, and detailed JSON statistics are saved to the specified file.
2. A Client/Server Test (Two Machines) This simulates traffic over a real network link.
- On the Server Machine (e.g., IP 192.168.1.101): Start the server to listen for traffic defined in the basic config file.
elina-tg server --config configs/basic/flows_config_basic.json --listen_ip 0.0.0.0 -v
- On the Client Machine: Send traffic to the server for 60 seconds.
elina-tg client --config configs/basic/flows_config_basic.json --dest_ip 192.168.1.101 --duration 60 -v
3. Scheduler Mode (Automated Test Sequences) This mode executes a series of client/server actions defined in a schedule file. It's ideal for emulating complex, time-varying traffic patterns.
# Run the pre-defined ITU-T G.1051 e-Gaming simulation
elina-tg schedule --schedule_config configs/itu_g1051_egaming/schedule_config_egaming_g1051.json -v
The Predefined Profile Library
Elina-TG comes with a rich library of expertly crafted simulation template profiles located in the configs/ directory.
You will need to modify them to fit your use cases.
These are organized by category:
/basic: Simple "getting started" configurations./feature-examples: Files that demonstrate specific advanced features of Elina-TG./teams&/zoom: Profiles that emulate the traffic patterns of Microsoft Teams and Zoom video calls, including realistic QoS markings./itu_g1051_egaming: A scheduler-based simulation for the ITU-T G.1051 e-Gaming standard./itu_g1051_dronecontrol: A profile simulating the highly asymmetrical traffic of a remote-controlled drone.
For detailed instructions on using these advanced profiles, please refer to the simulating-*.md guides located within each respective directory.
Visualisation of Results in LatenceTech Dashboards
When used in conjunction with the LatenceTech QoS-Agent, the traffic generated by Elina-TG can be monitored in real-time on the Analyzer dashboards. This allows you to generate specific application loads (like a Zoom call or a gaming session) and immediately observe the impact on key performance indicators like latency, jitter, and packet loss, providing a powerful cause-and-effect analysis of your network's performance.
Important Notes
- Permissions for DSCP/QoS: On some systems, setting DSCP values may require running the script with elevated privileges (e.g.,
sudo elina-tg ...). - Scheduler Paths: When using the scheduler, ensure the
flow_config_filepaths inside your schedule file are correct and relative to the project's root directory. - Detailed Documentation: For a complete overview of all features, command-line arguments, and the structure of the JSON statistics file, please refer to the
README.mdanddocumentation/Statistics_Logs.mdfiles included in the package.